“This was the highest-priority initiative in the company. We built the foundation for Wayfair’s future.”
Design Process
Discover & Define → Frame the Challenge → Design & Deliver
1. Discover & Define
When I joined, Wayfair’s customer experience replatforming effort was at risk:
- Zero percent of customer journeys had been fully migrated
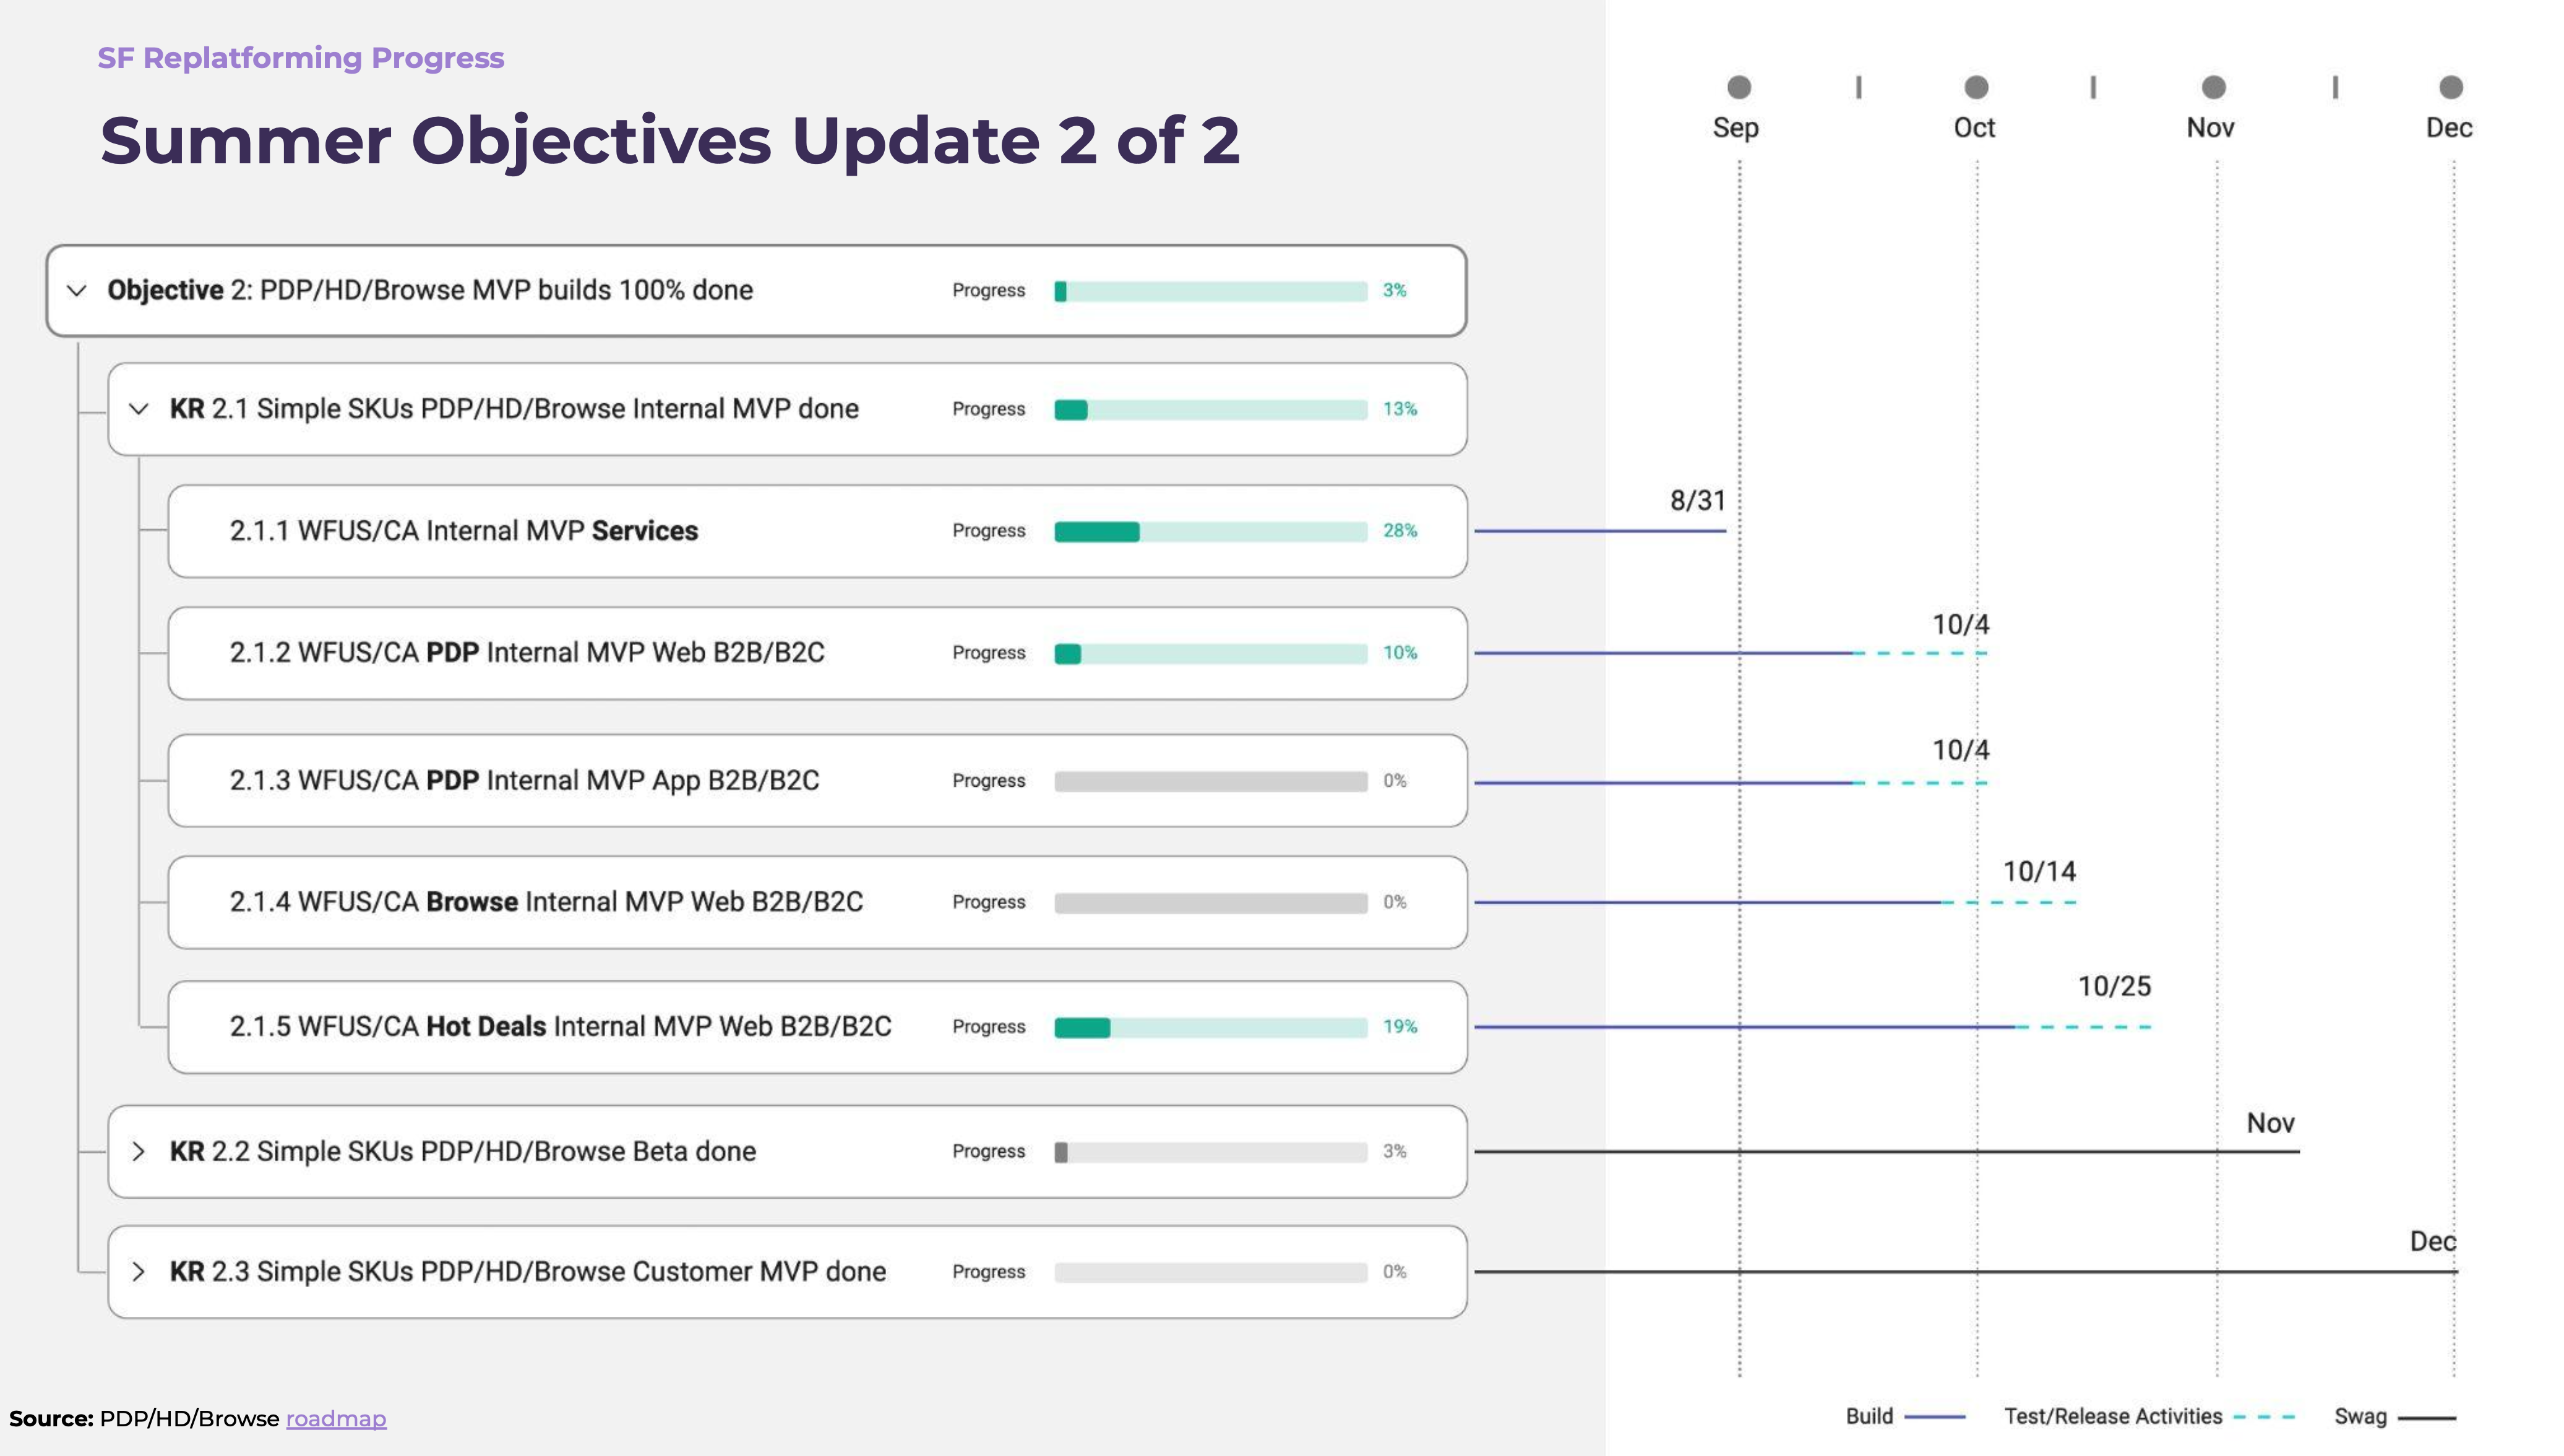
- Prior OKRs were unmet and not tracked consistently
- 35+ teams worked in silos with unclear visibility
- Leadership lacked real-time insight into outcomes
My focus was to create a unified AI-enhanced product that bridged strategy, delivery, and reporting. With the goal of transforming how the company made progress visible, and team priorities easy to understand and execute against.
2. Frame the Challenge
The problem was not just execution, but lack of insight:
- No tool existed to connect Jira delivery with strategic OKRs
- Leadership had limited and inconsistent visibility into progress or blockers
- Manual reporting caused lags and misalignment
- Teams lacked clarity on how daily work contributed to business goals
The challenge was to design a scalable, low-friction system that could ingest live delivery data, synthesize it with AI, and generate actionable OKR updates in real time.
3. Design & Deliver
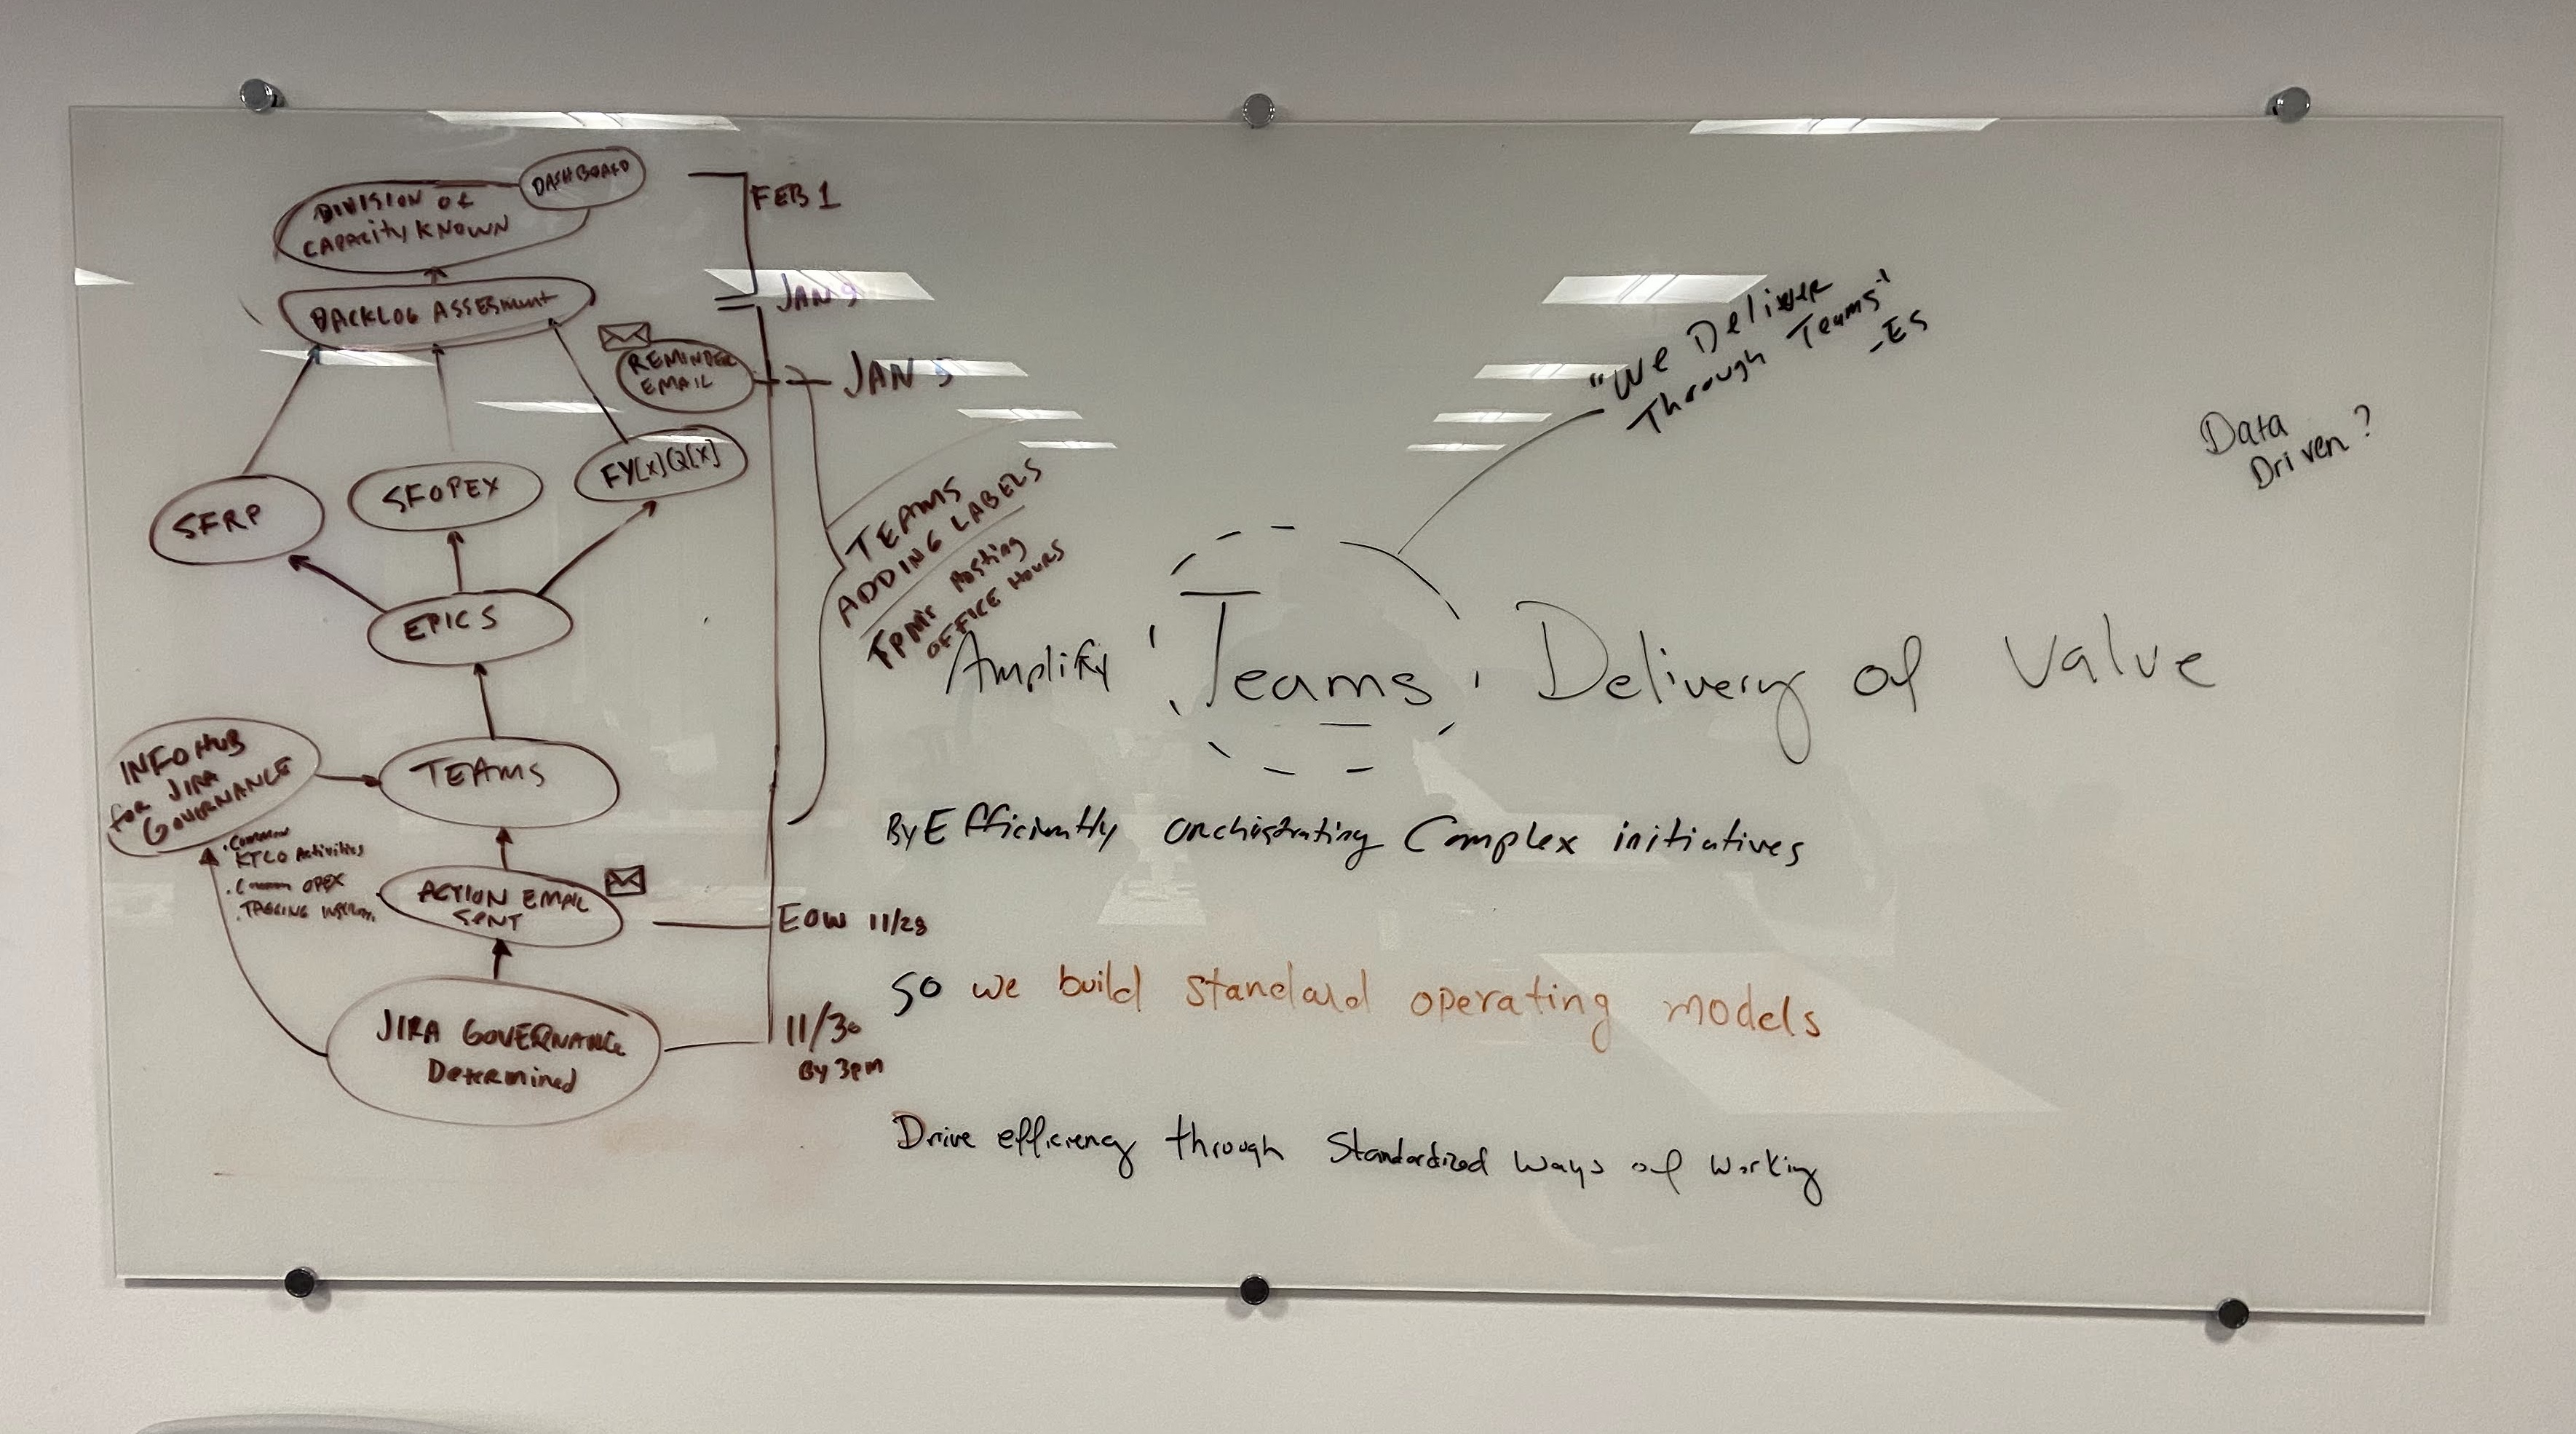
Research & System Mapping
- Conducted interviews with PMs, EMs, and VPs to define reporting pain points
- Audited how OKRs were tracked (or not) across the org
- Mapped Jira structures to strategic planning cycles
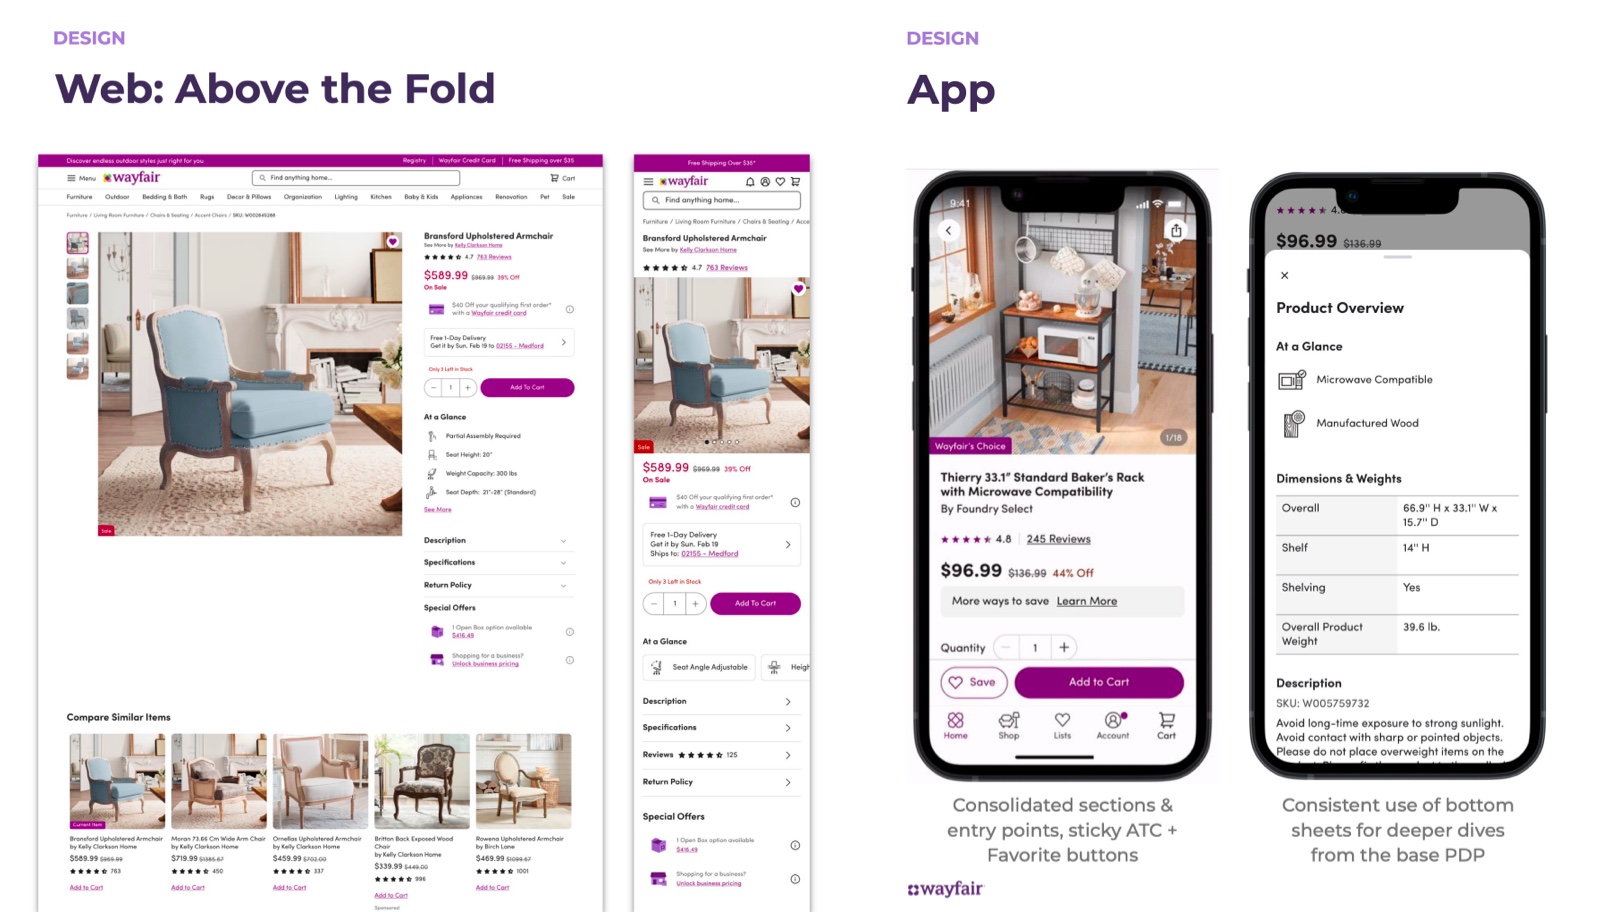
Product Design
- Designed UX for goal tracking, weekly status, and risk surfacing
- Built GPT prompts to summarize delivery and surface blockers
- Created story generation flow to improve quality of backlog items
- Iterated through feedback with leadership and delivery teams
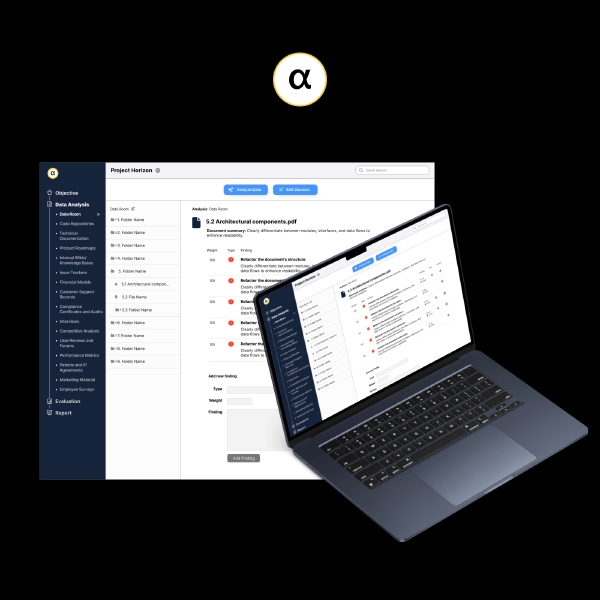
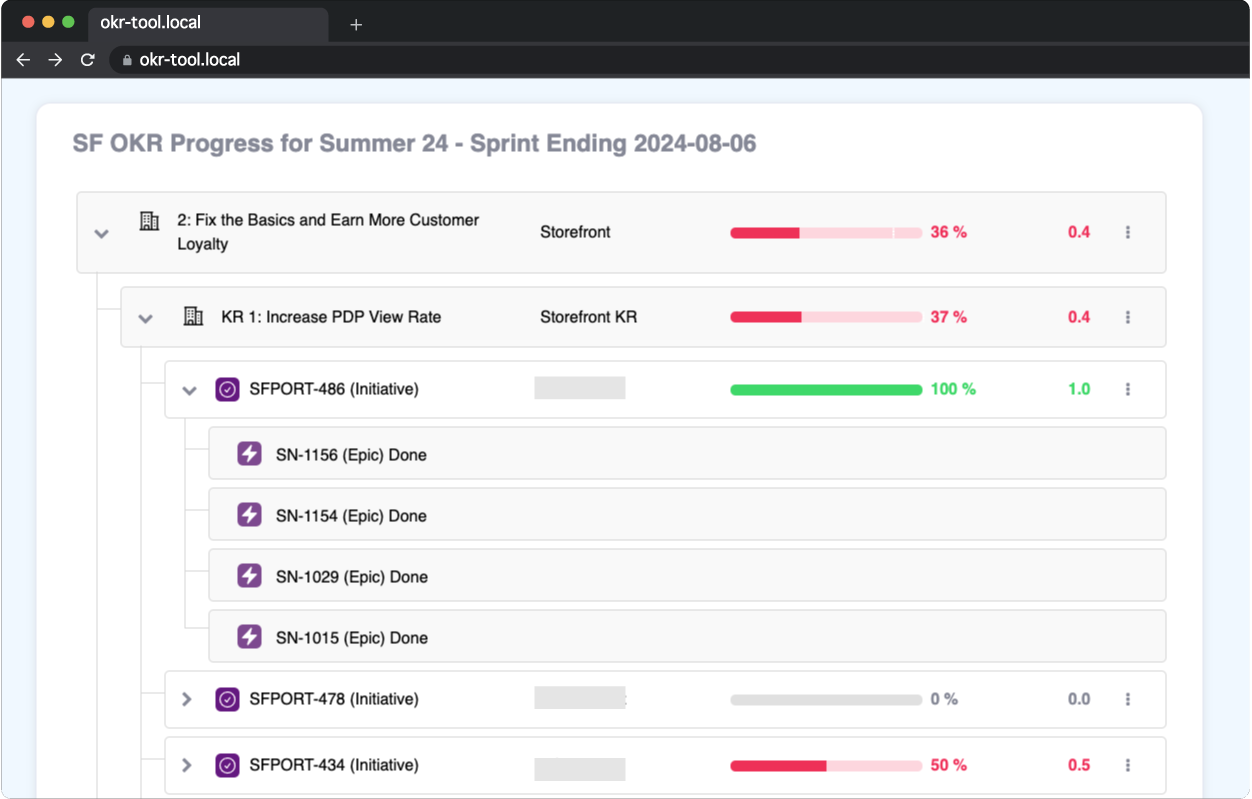
Dashboard & Reporting System
- Developed frontend dashboard using Jira data and custom logic
- Integrated AI-generated summaries into weekly reporting
- Enabled VP-level visibility into team progress, issues, and confidence
Launch & Iterate
- Piloted with 4 high-impact teams, then scaled to 35+
- Used live data to validate cycle progress and milestone success
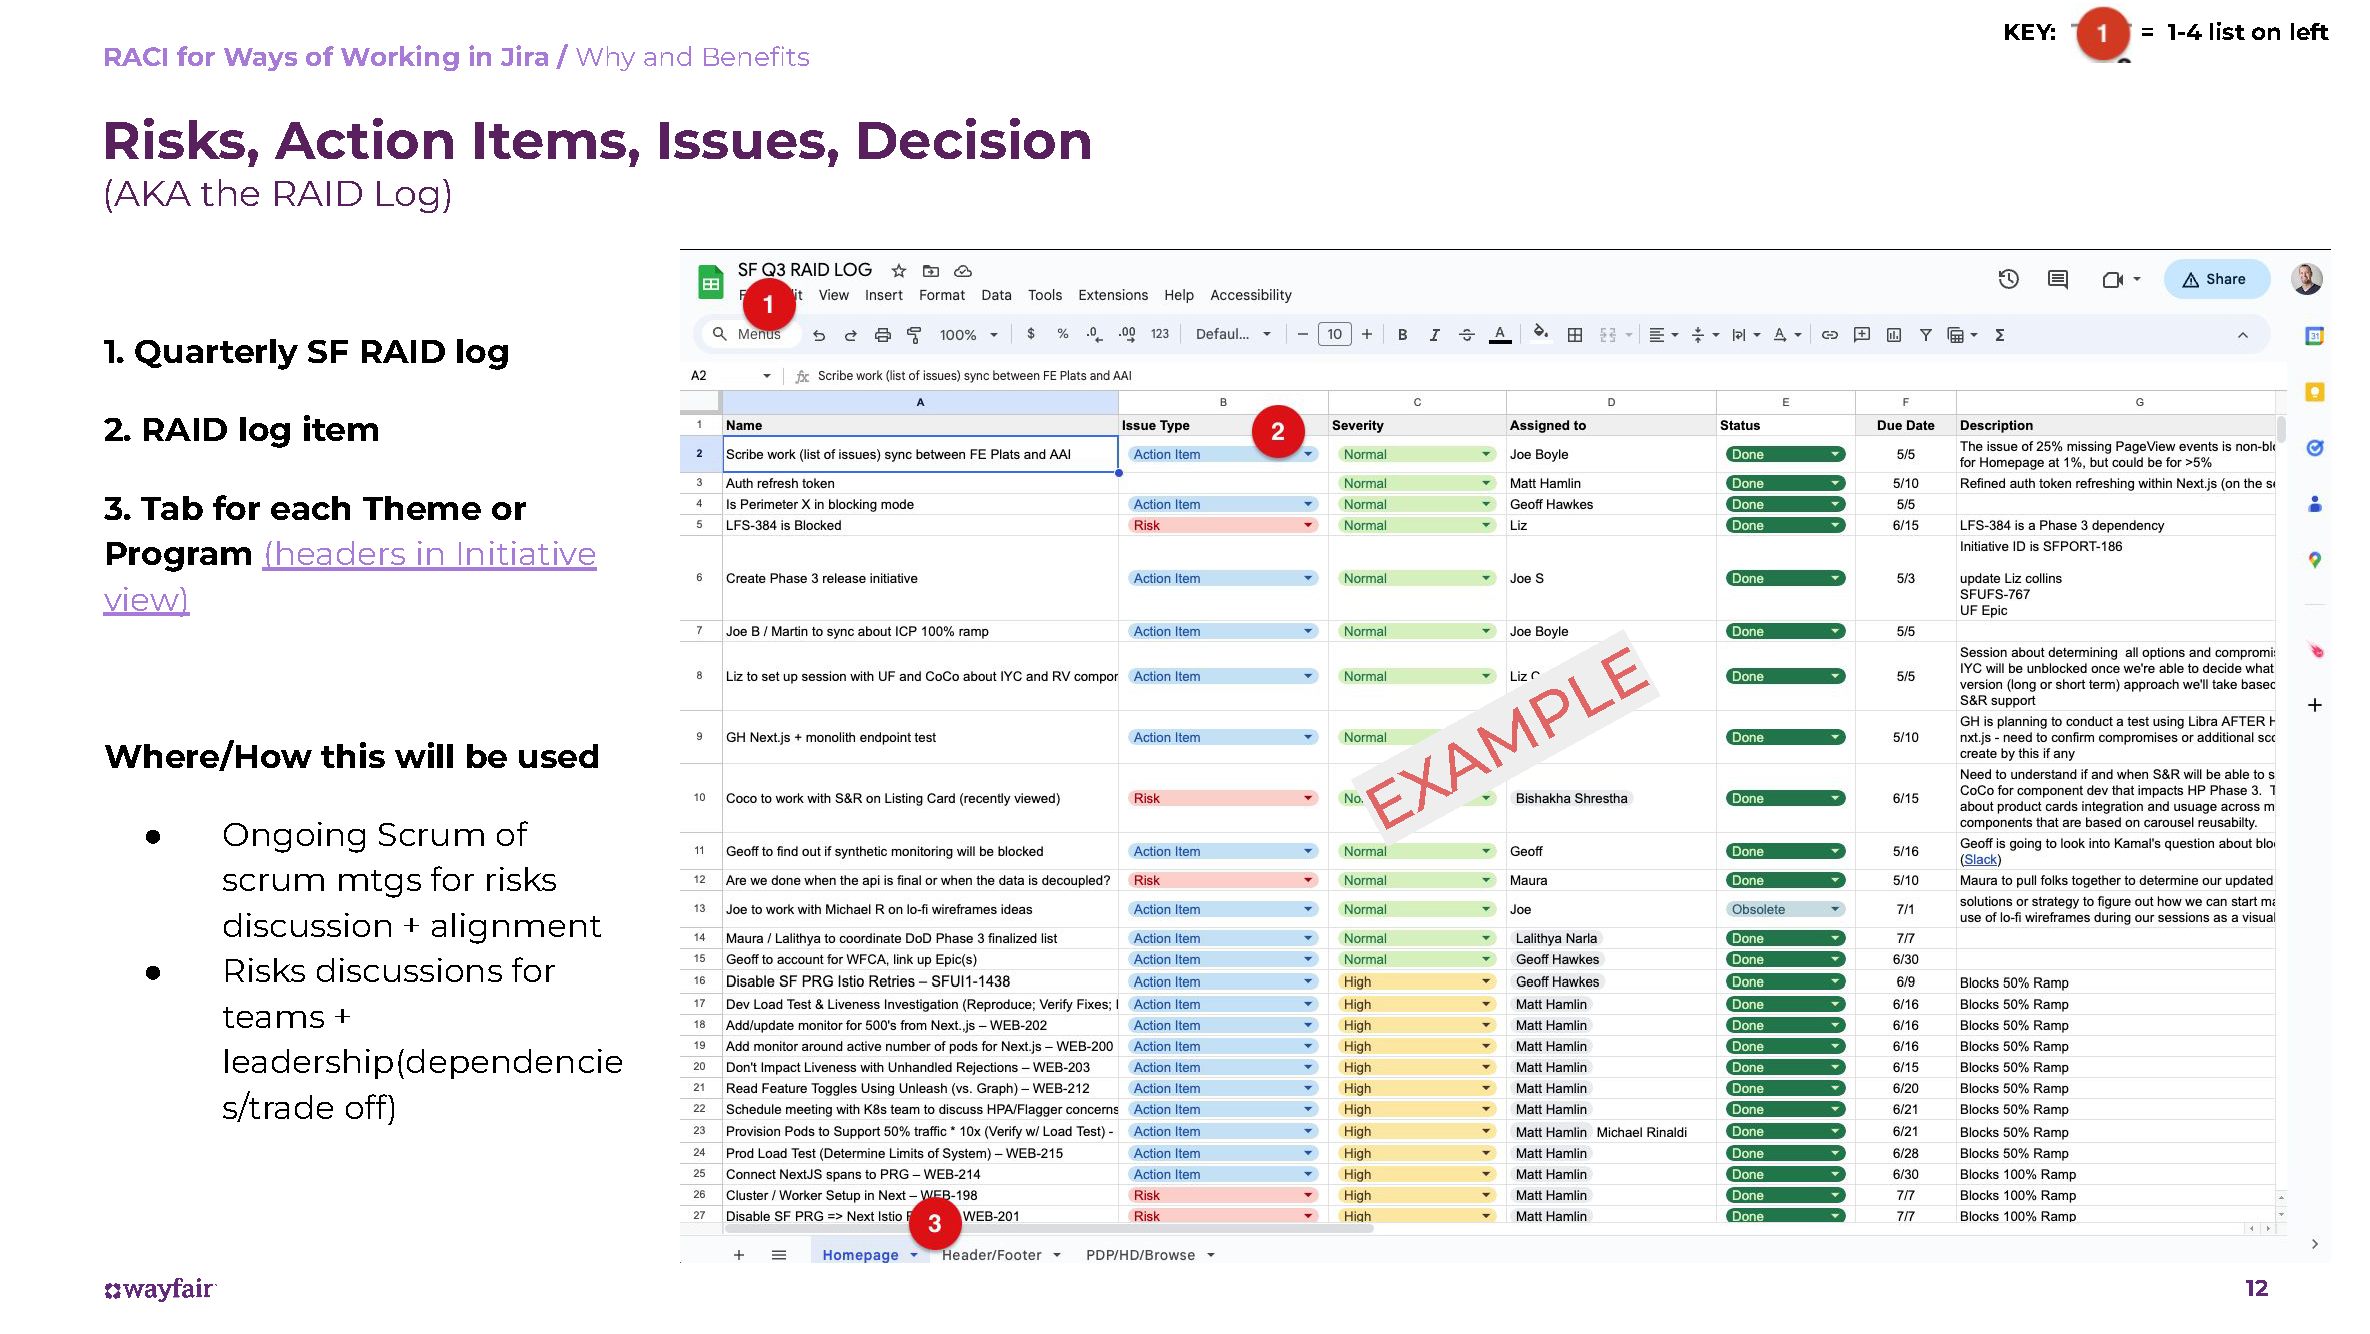
- Automated weekly updates, risk flags, and trend summaries
- Integrated into Program Steering materials for leadership
Outcomes
Lessons Learned
- Visibility drives velocity — live OKR views changed how we delivered
- Designing for leadership — execs need different UX than contributors
- AI doesn’t replace context — it needs thoughtful scaffolding
- Progress is a product — make delivery a user experience
- Program insight is a system, not a spreadsheet
Want to connect strategy with delivery?
Let’s design smarter, faster ways to turn goals into outcomes.
Let’s talk