$100M Transformation

Wayfair Customer Experience:

Leading a $100M Digital Transformation

Image of web and app product detail page
One of hundreds of screens replatformed across Web and native App.

“This was the highest-priority initiative in the company. We built the foundation for Wayfair’s future.”


Project Summary

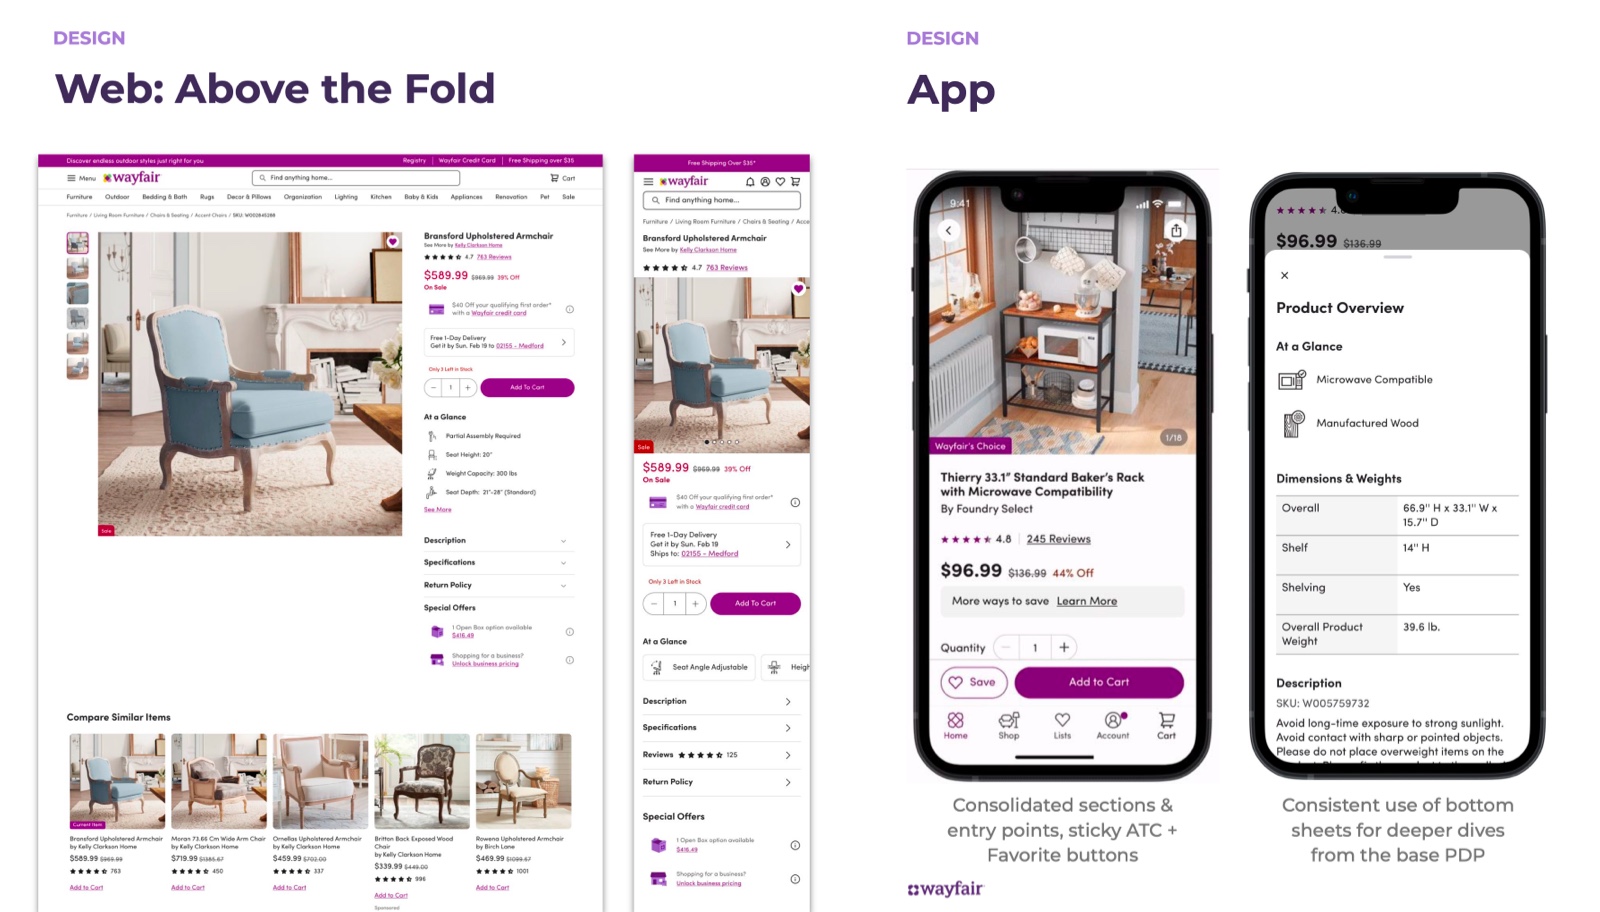
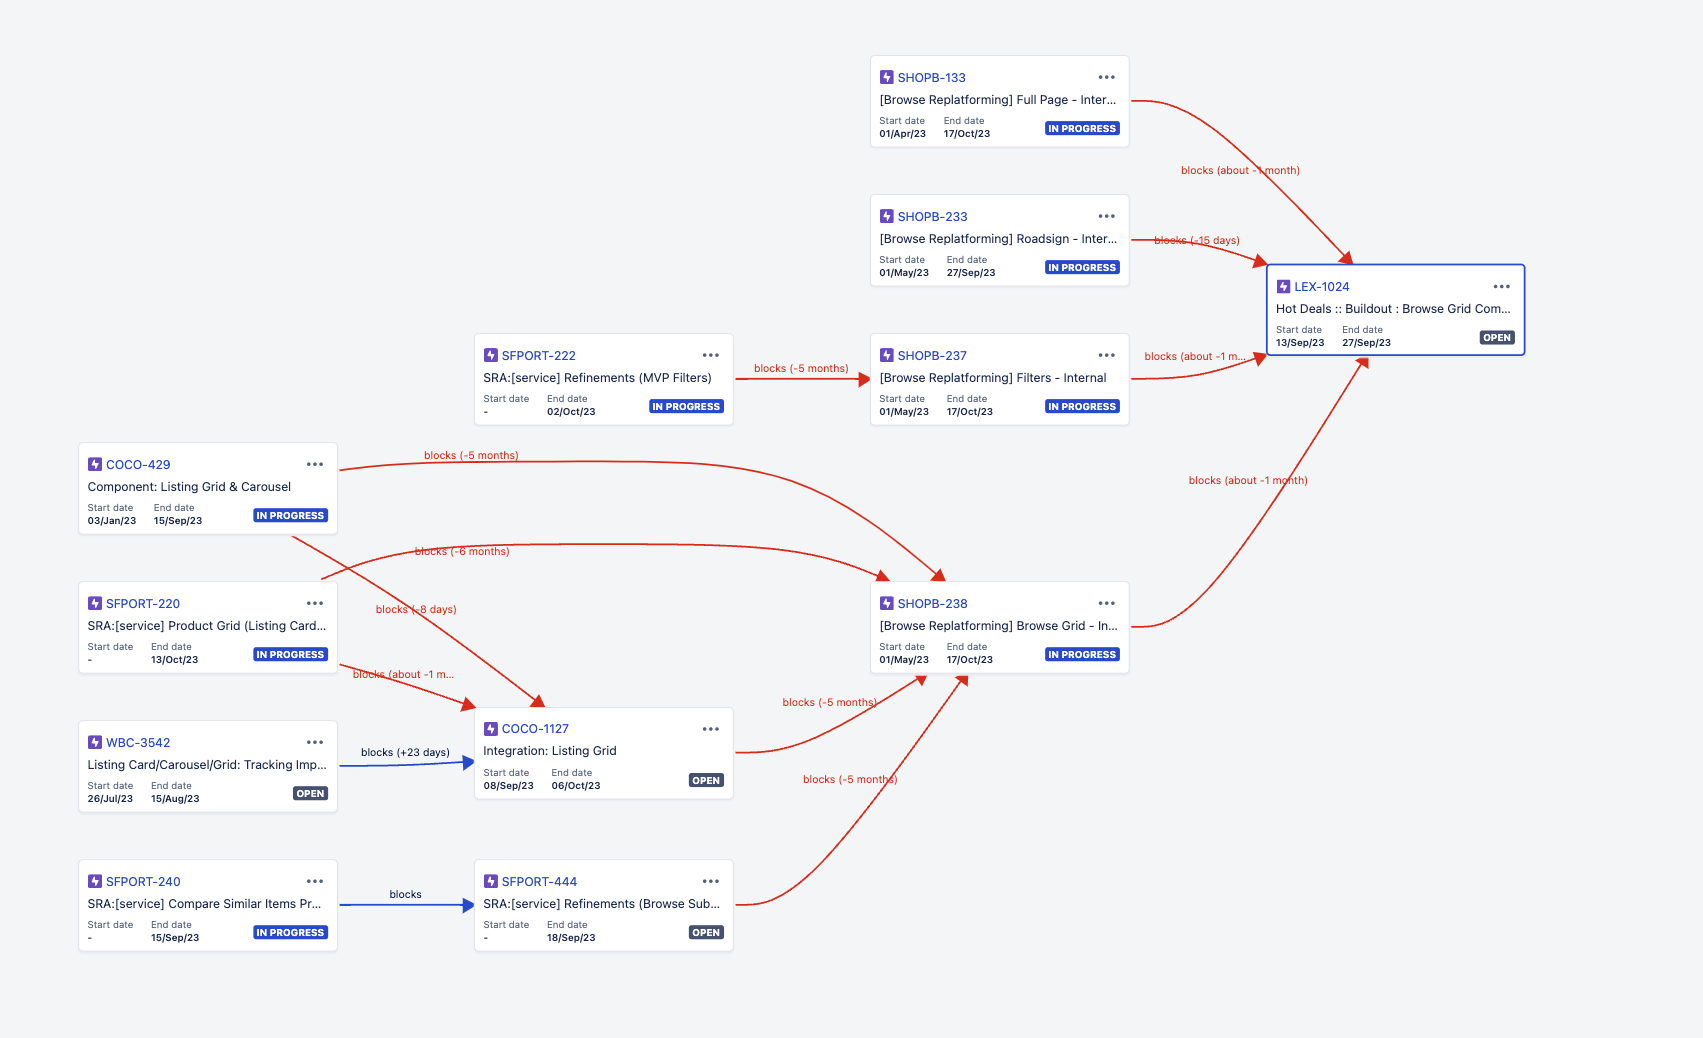
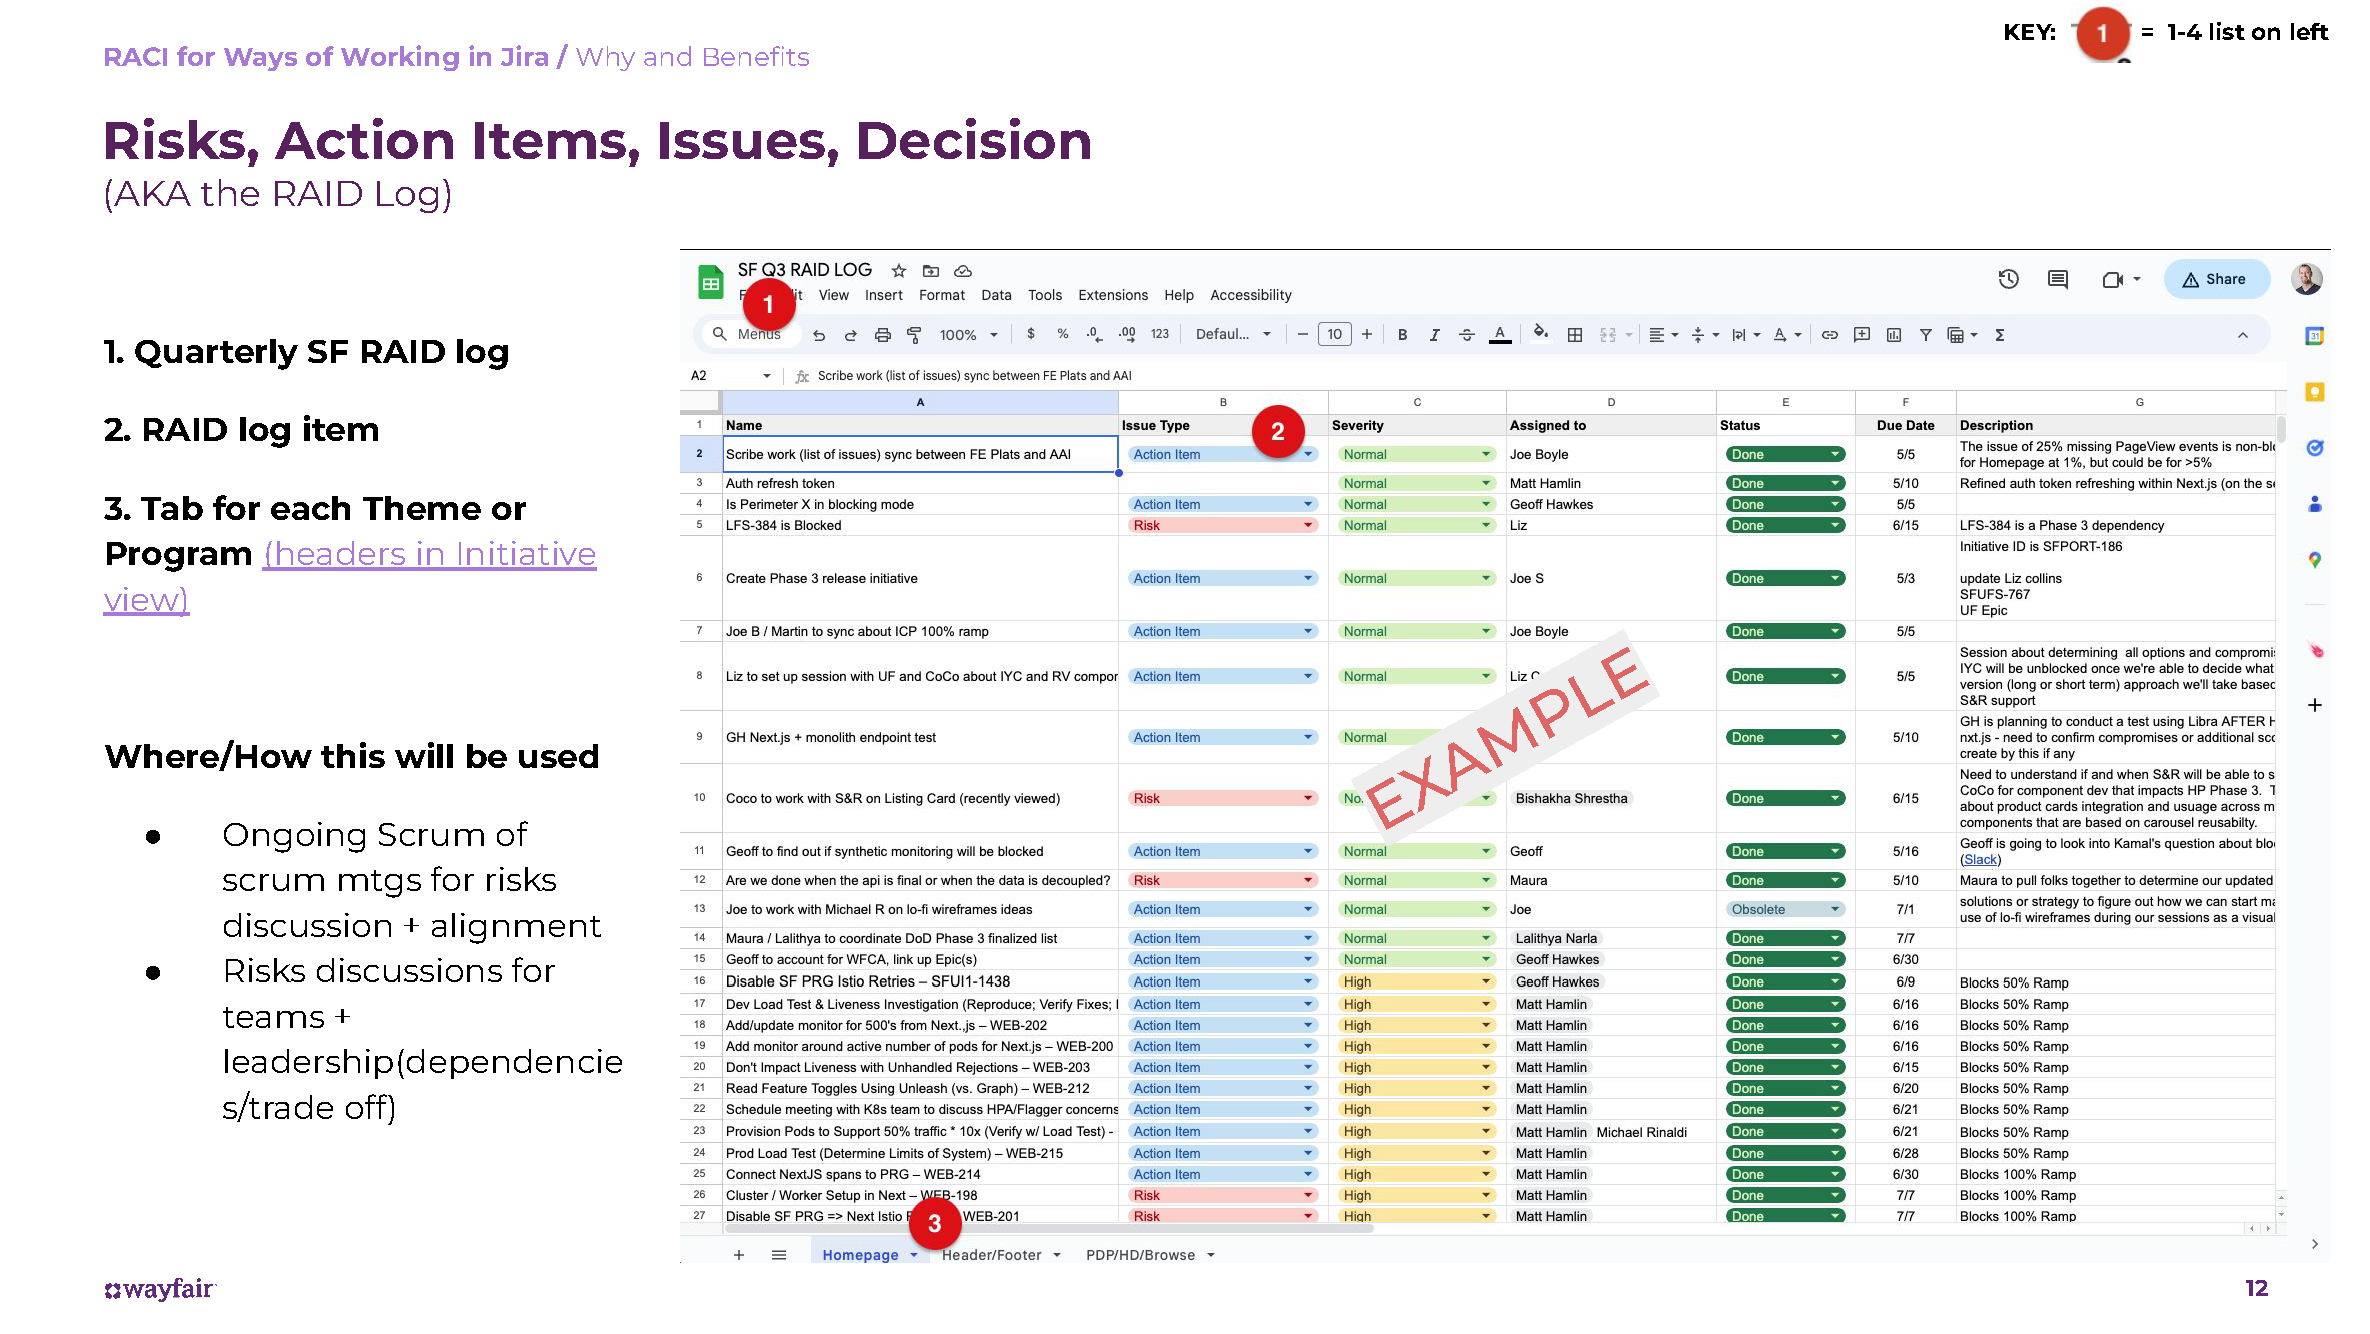
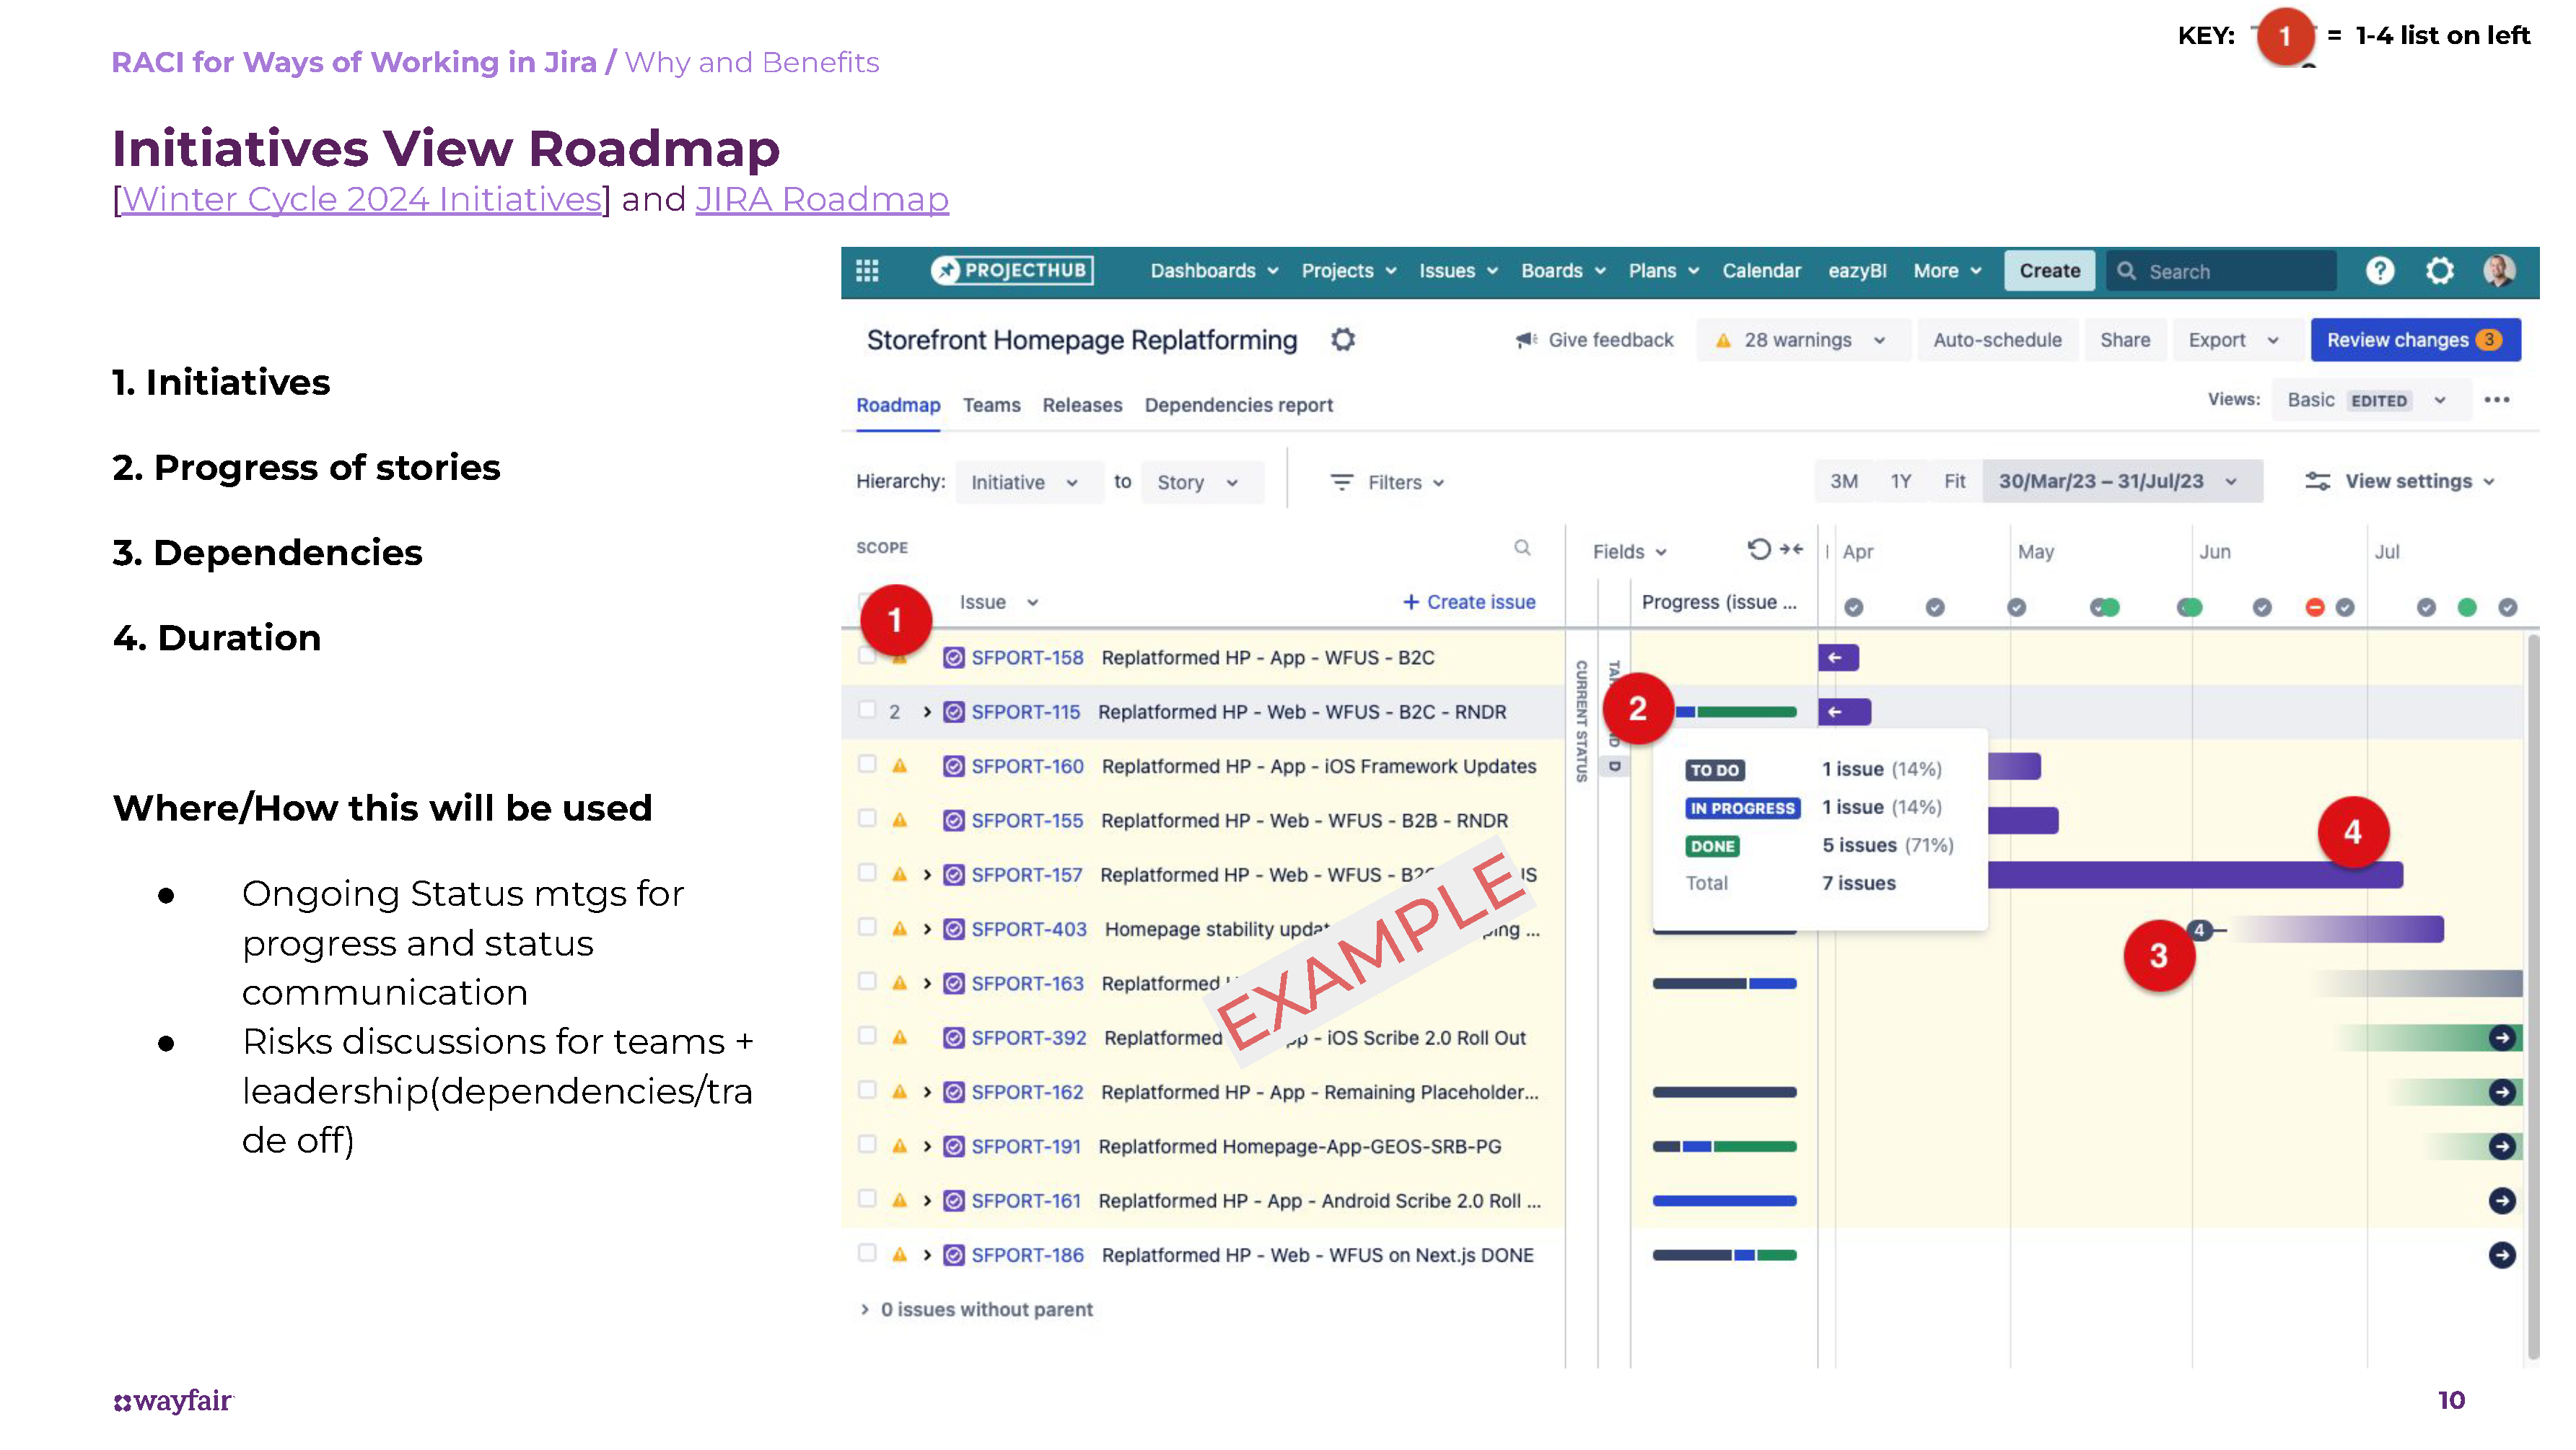
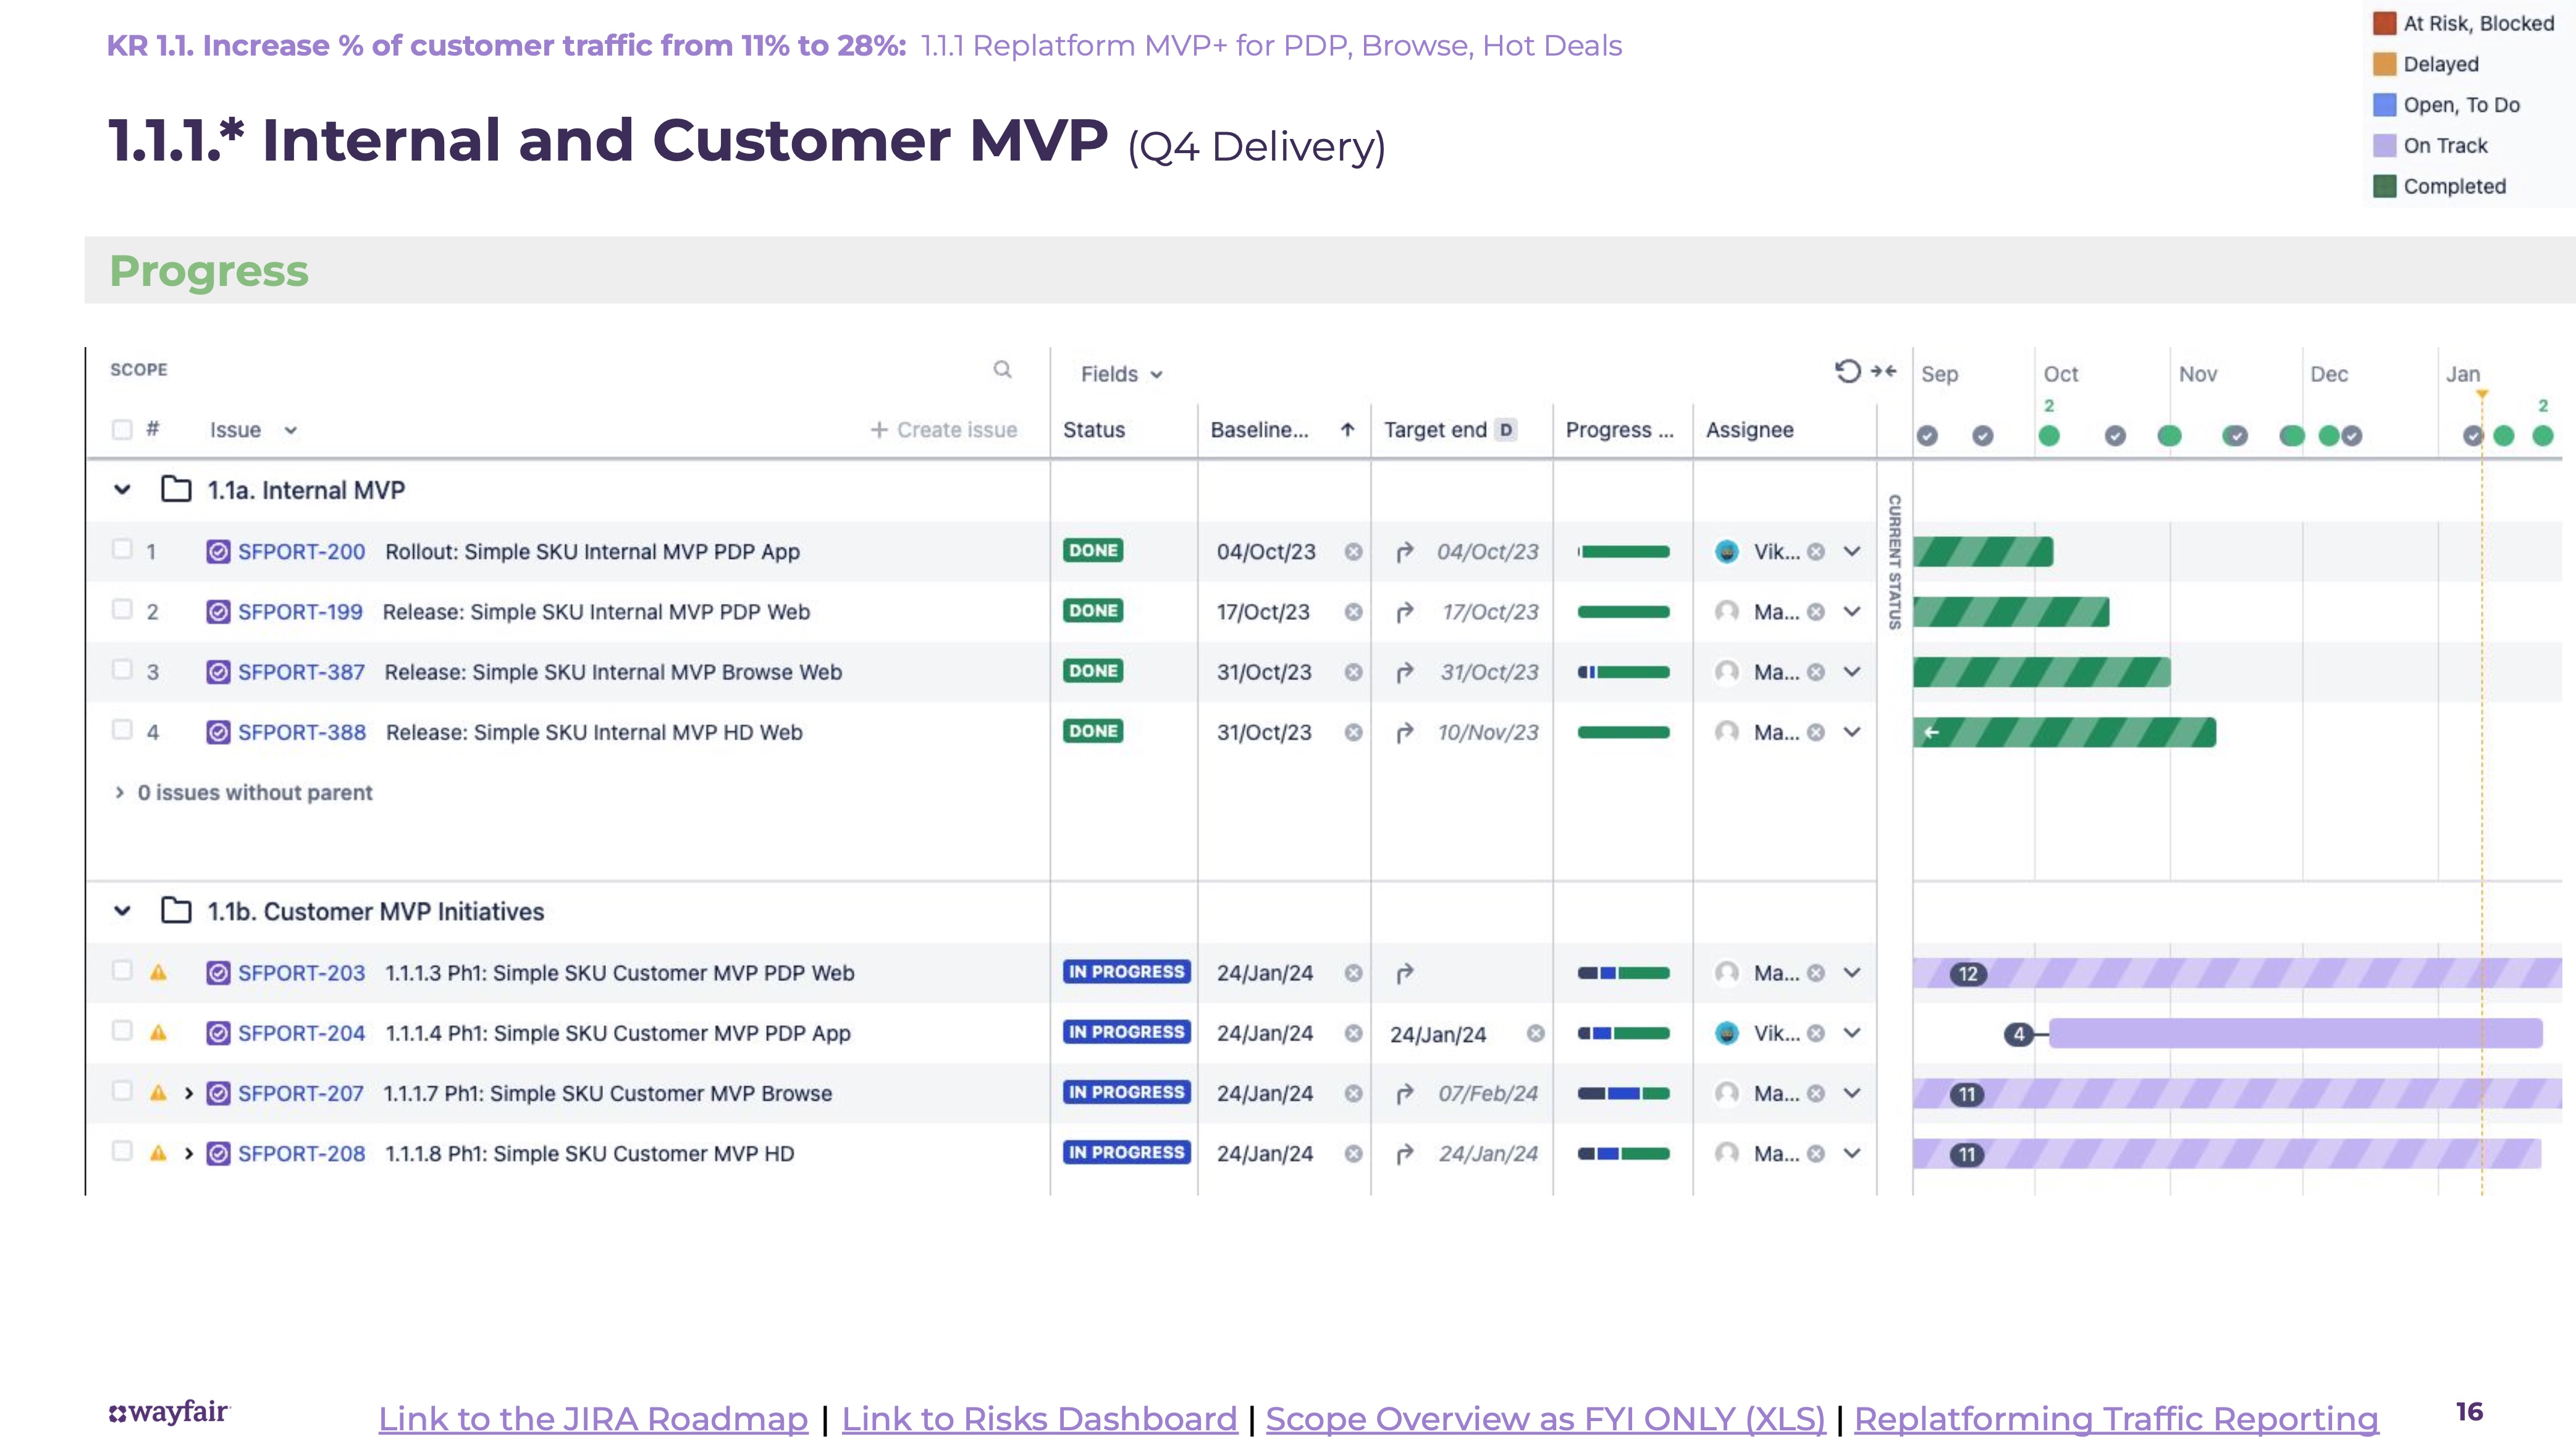
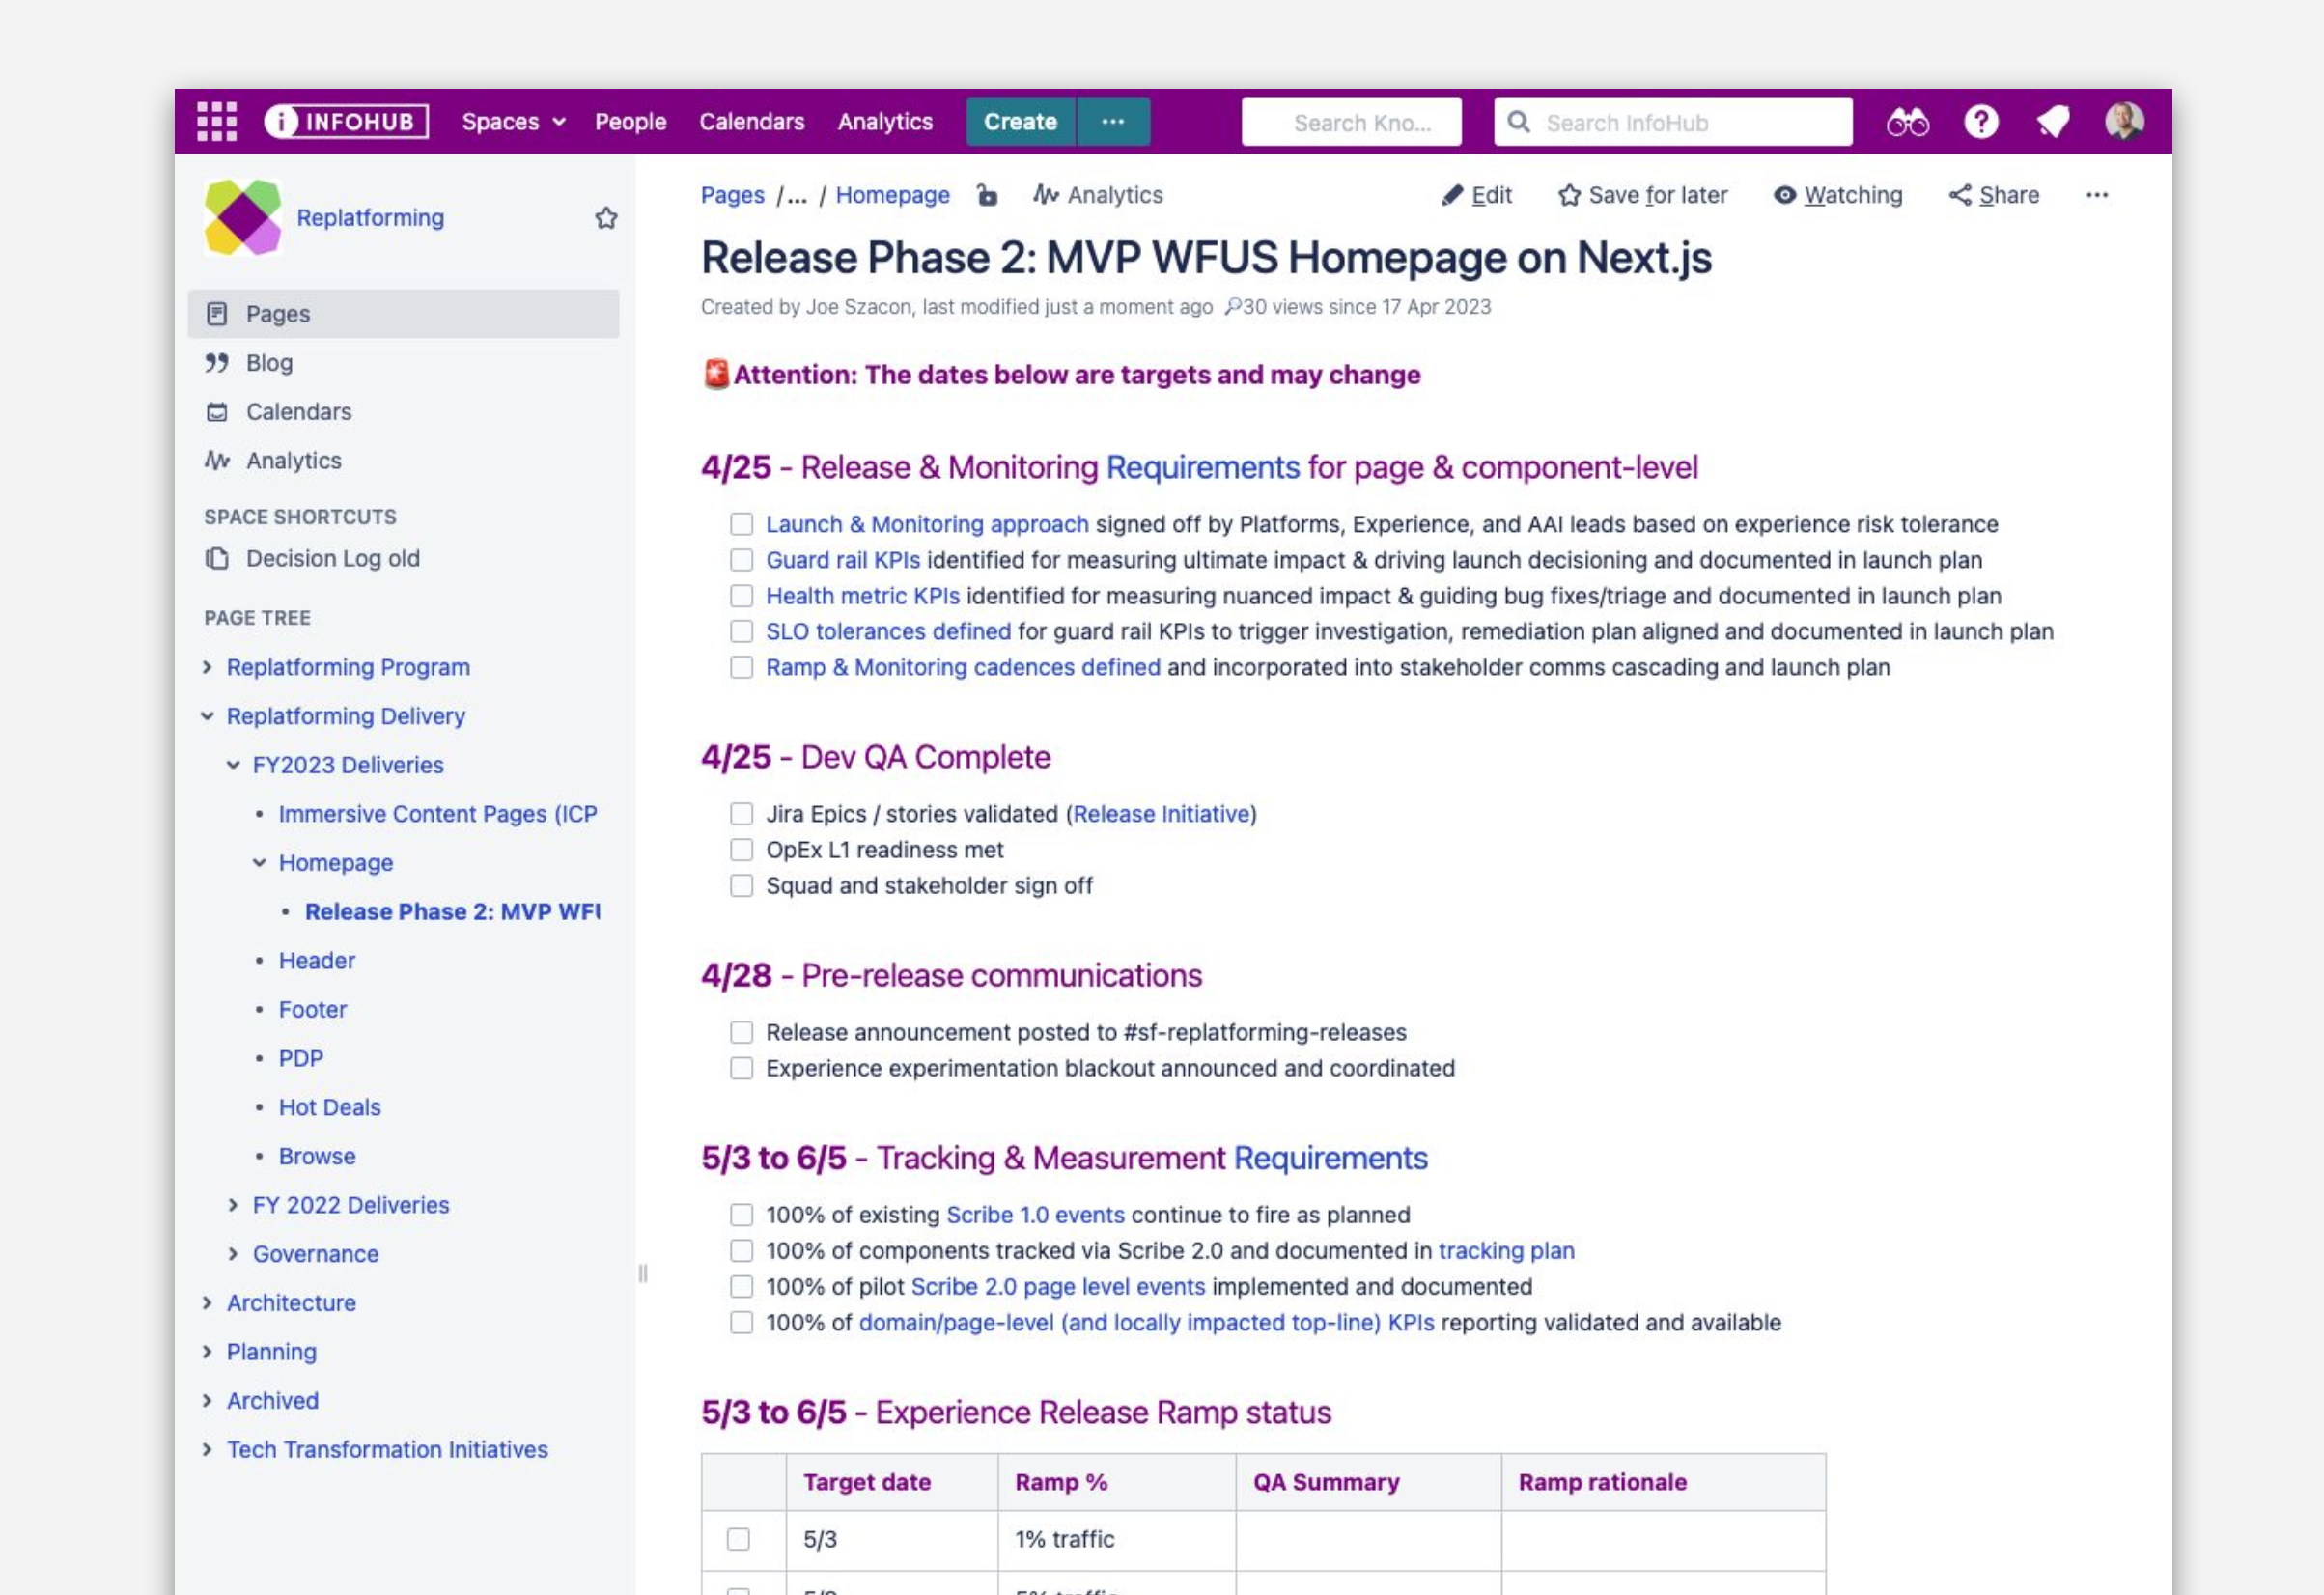
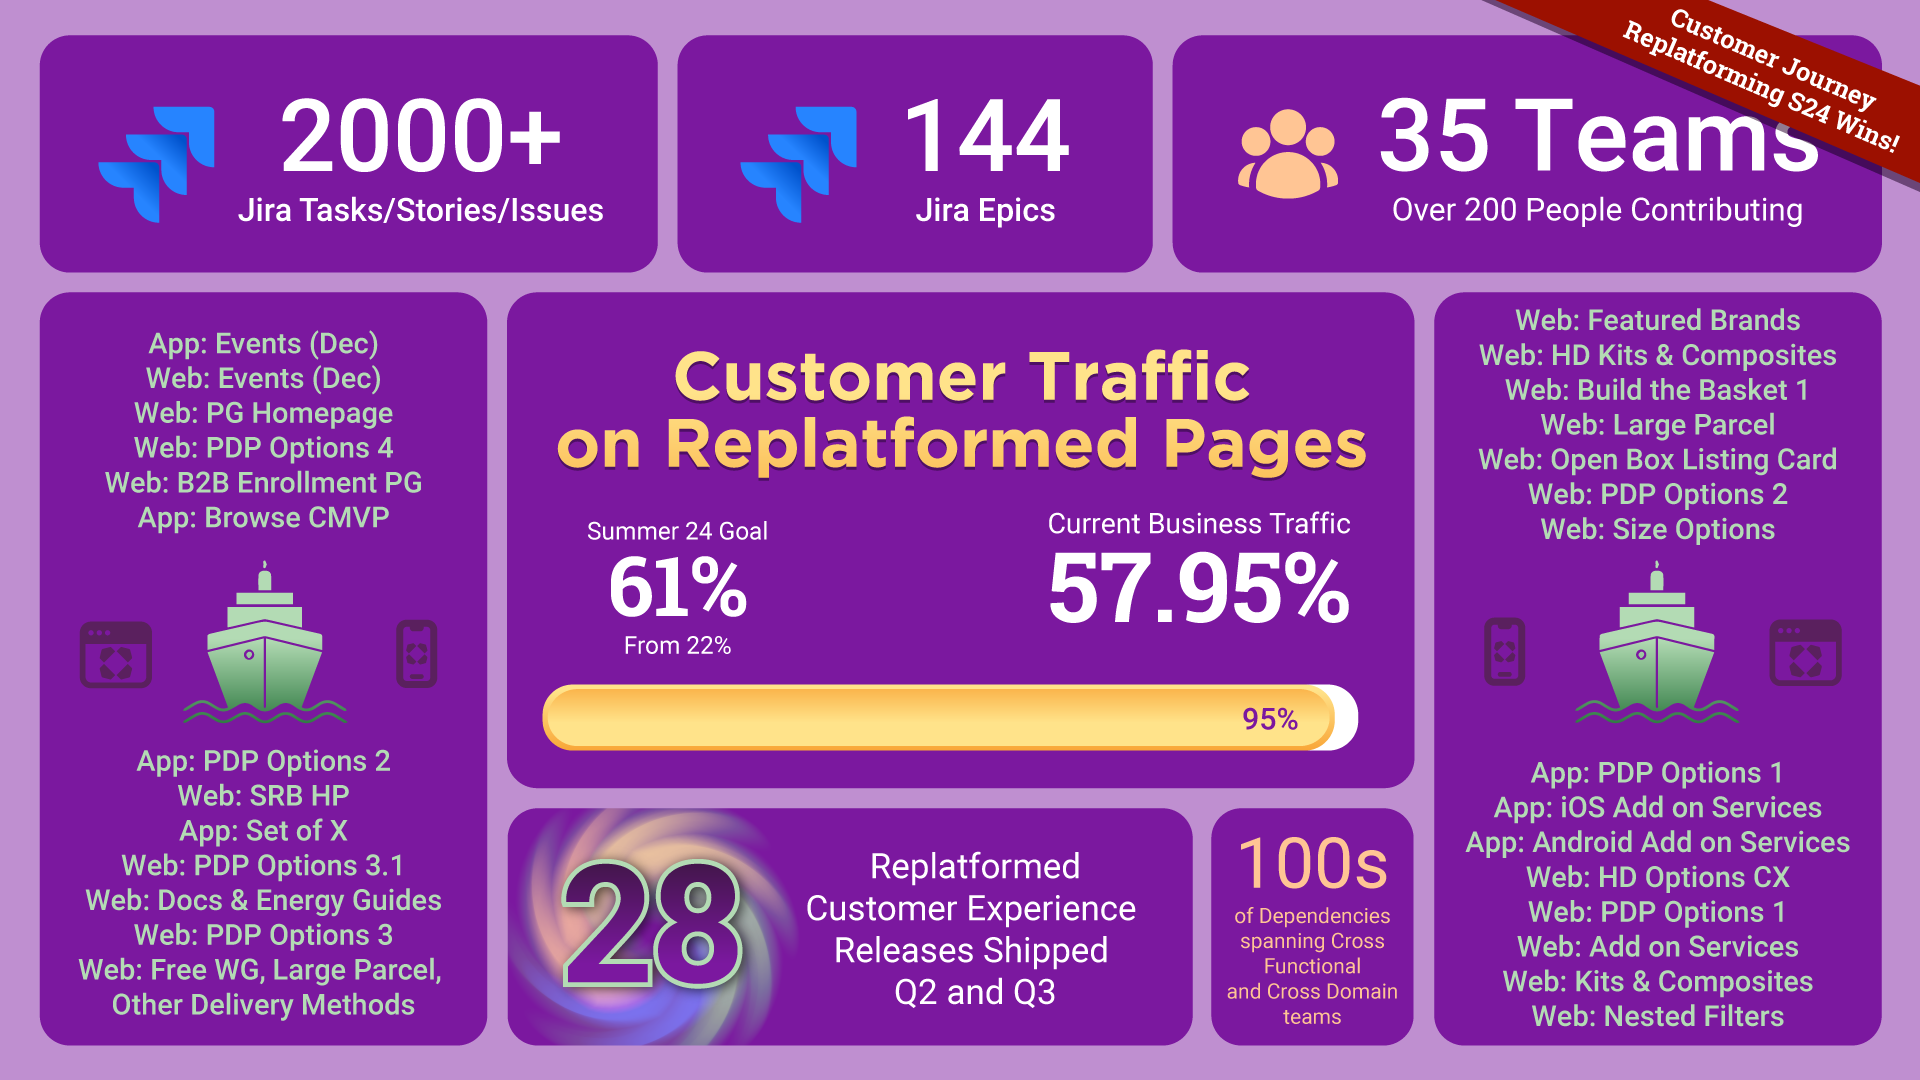
Wayfair needed to replatform its entire customer journey experience across five brands and four international markets. This affected billions in revenue and traffic. When I joined, only 22 percent of journeys had migrated, goals were unmet, and coordination was breaking down.

My Role:
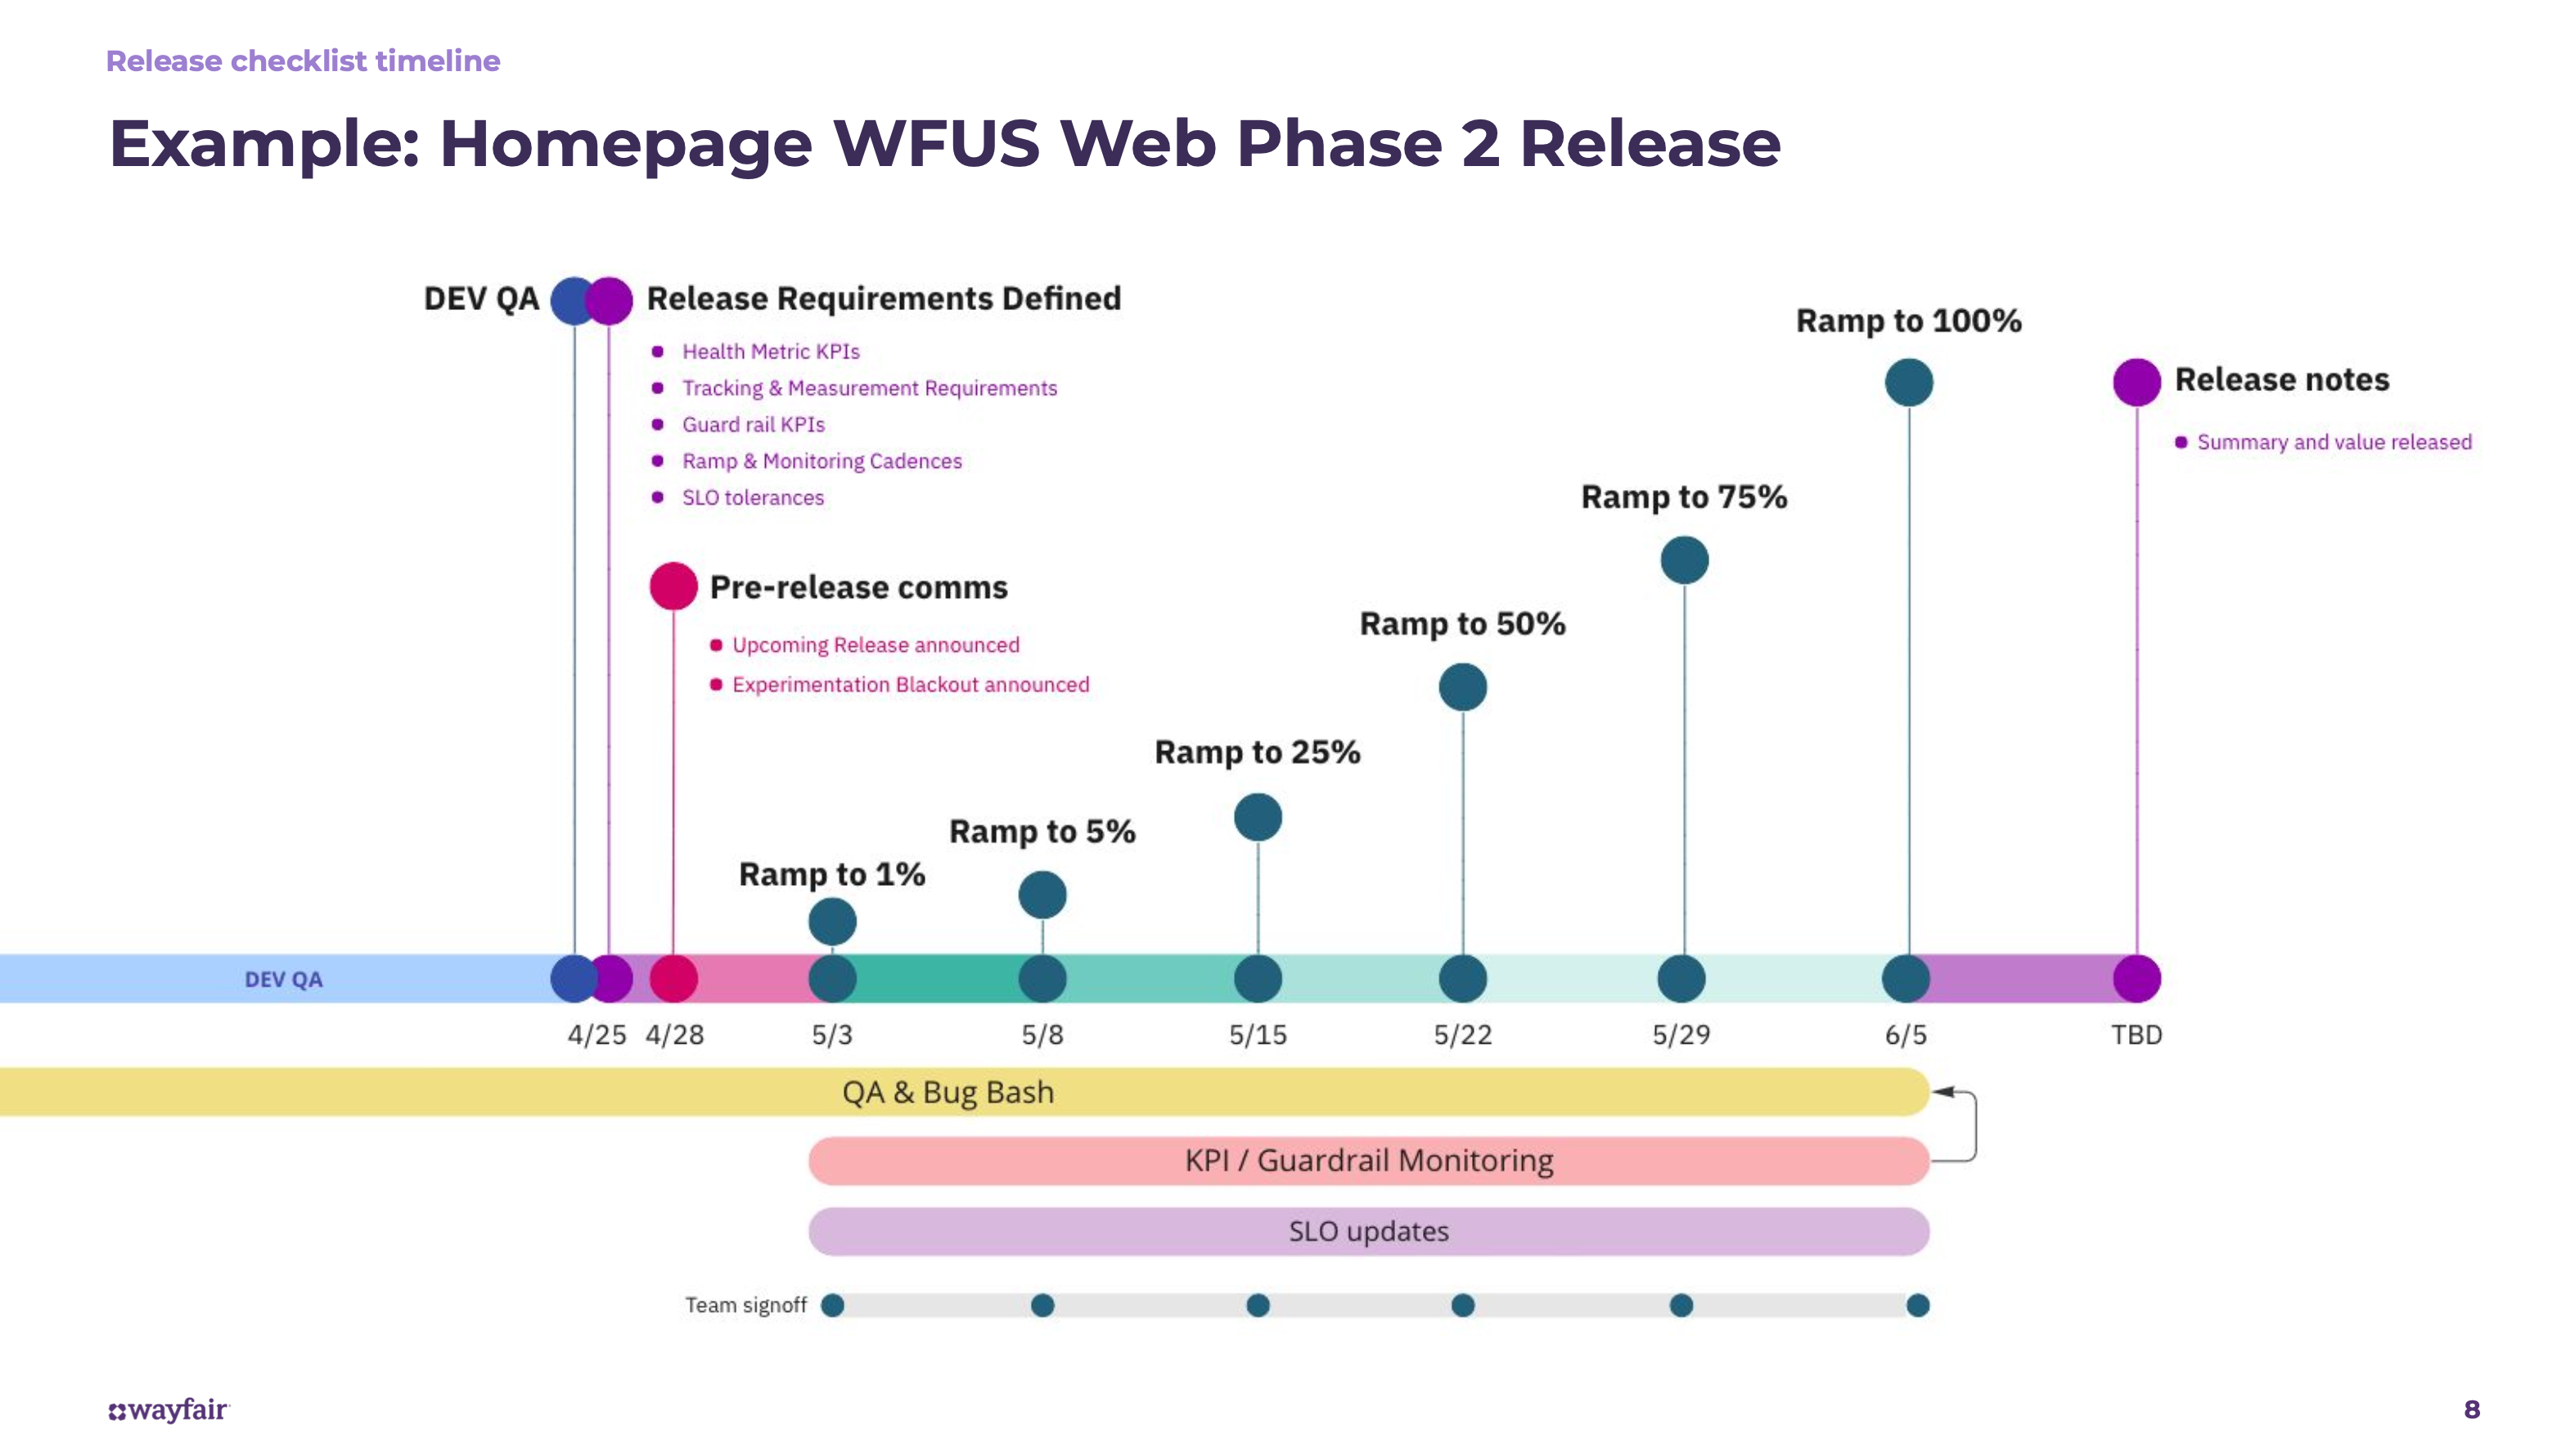
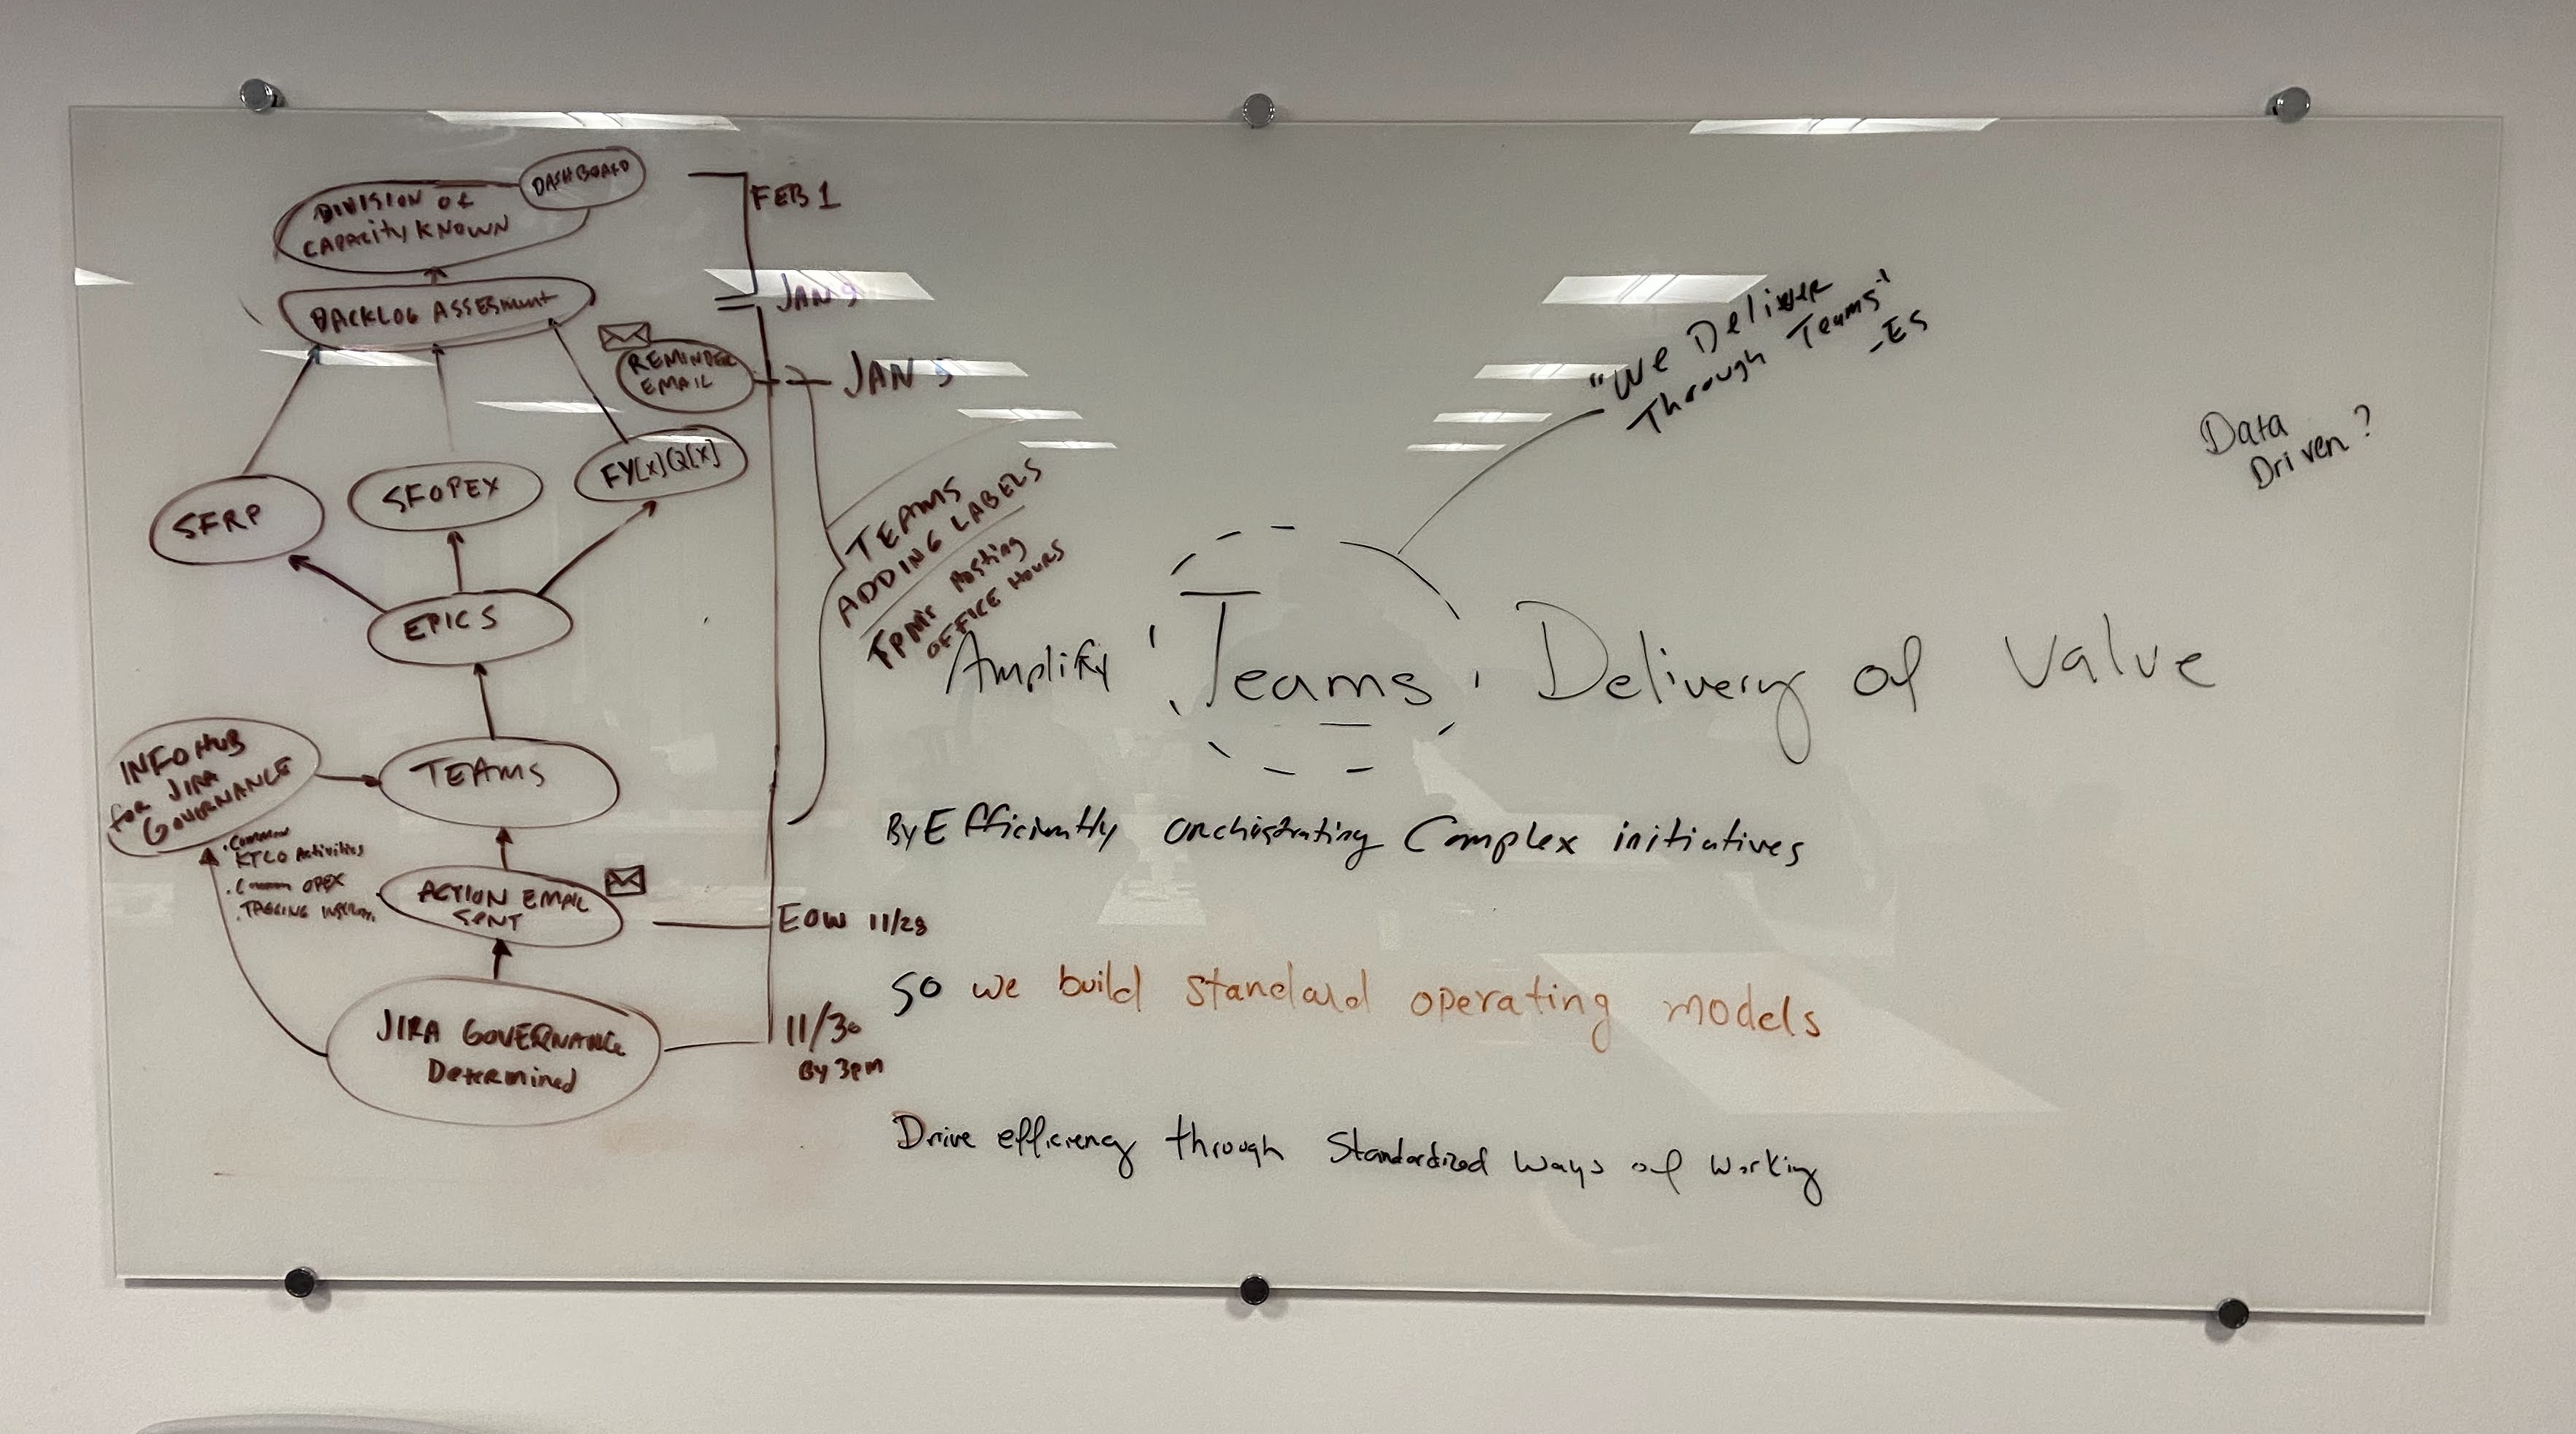
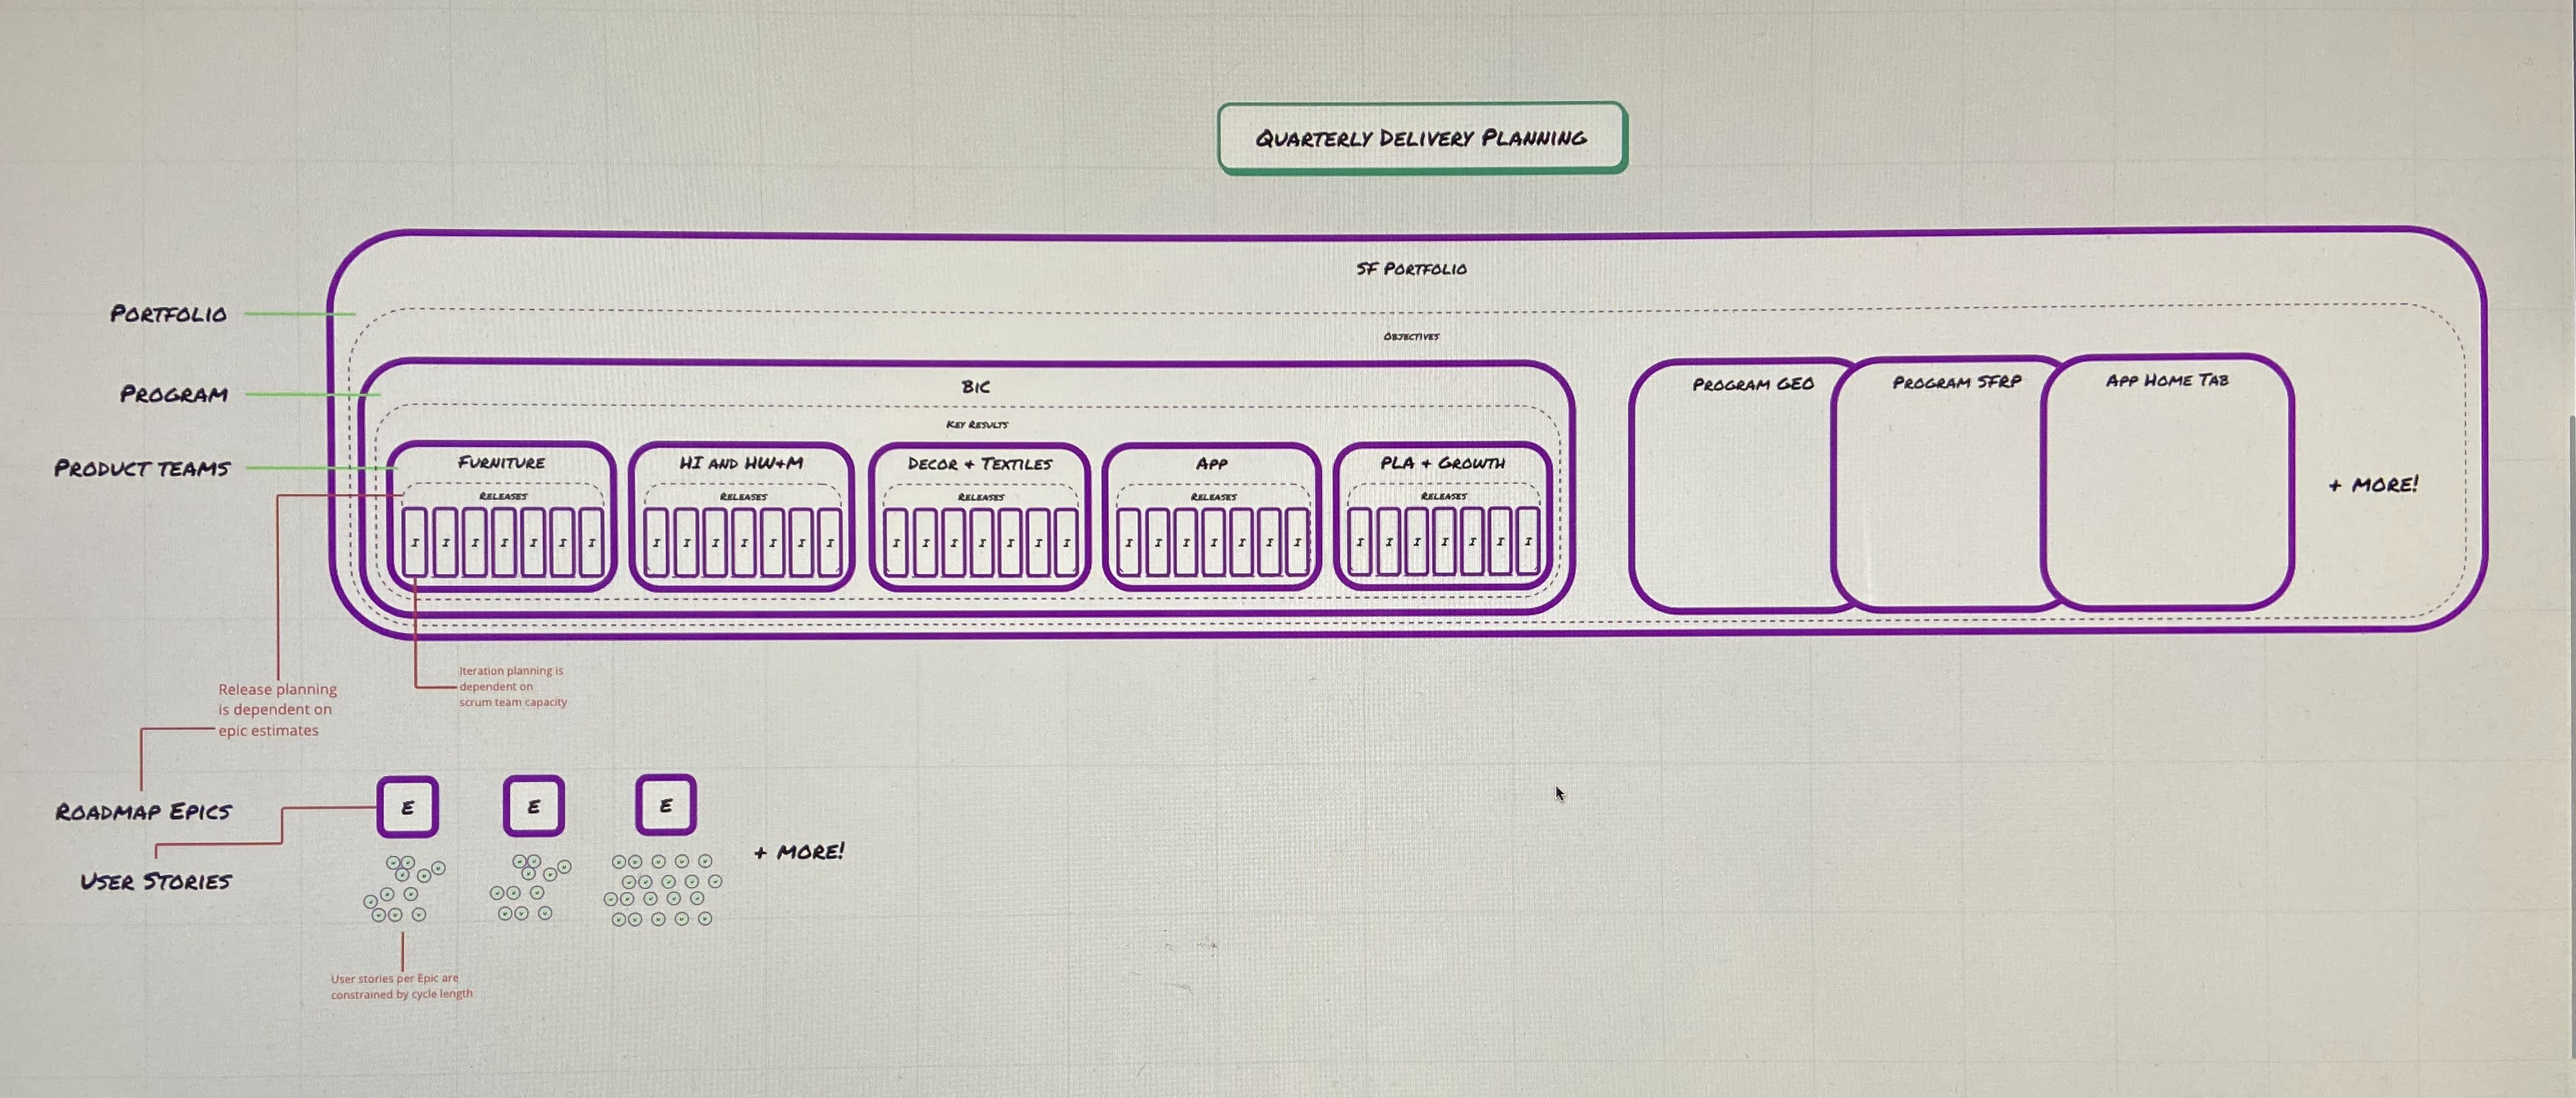
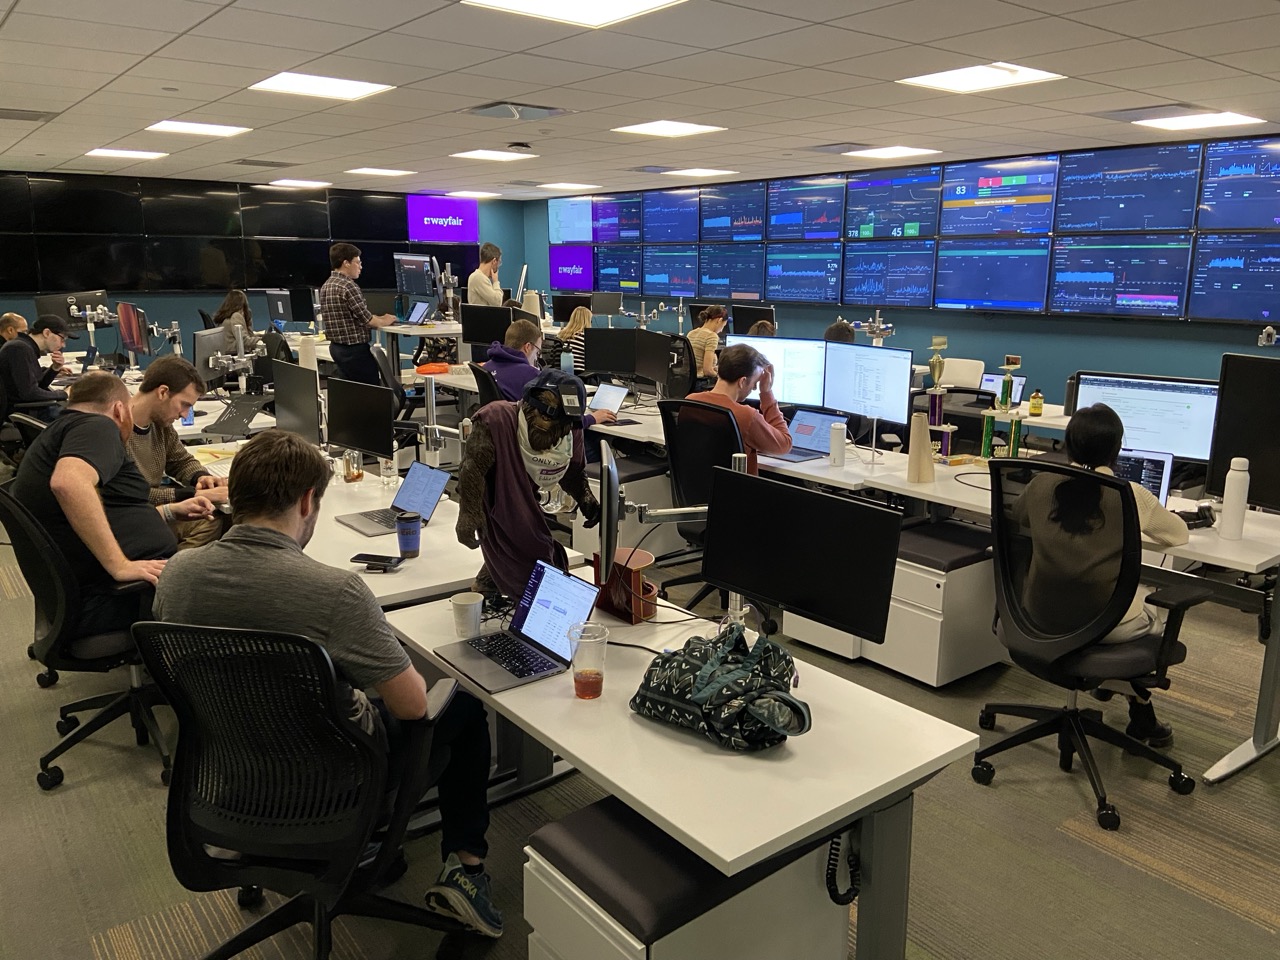
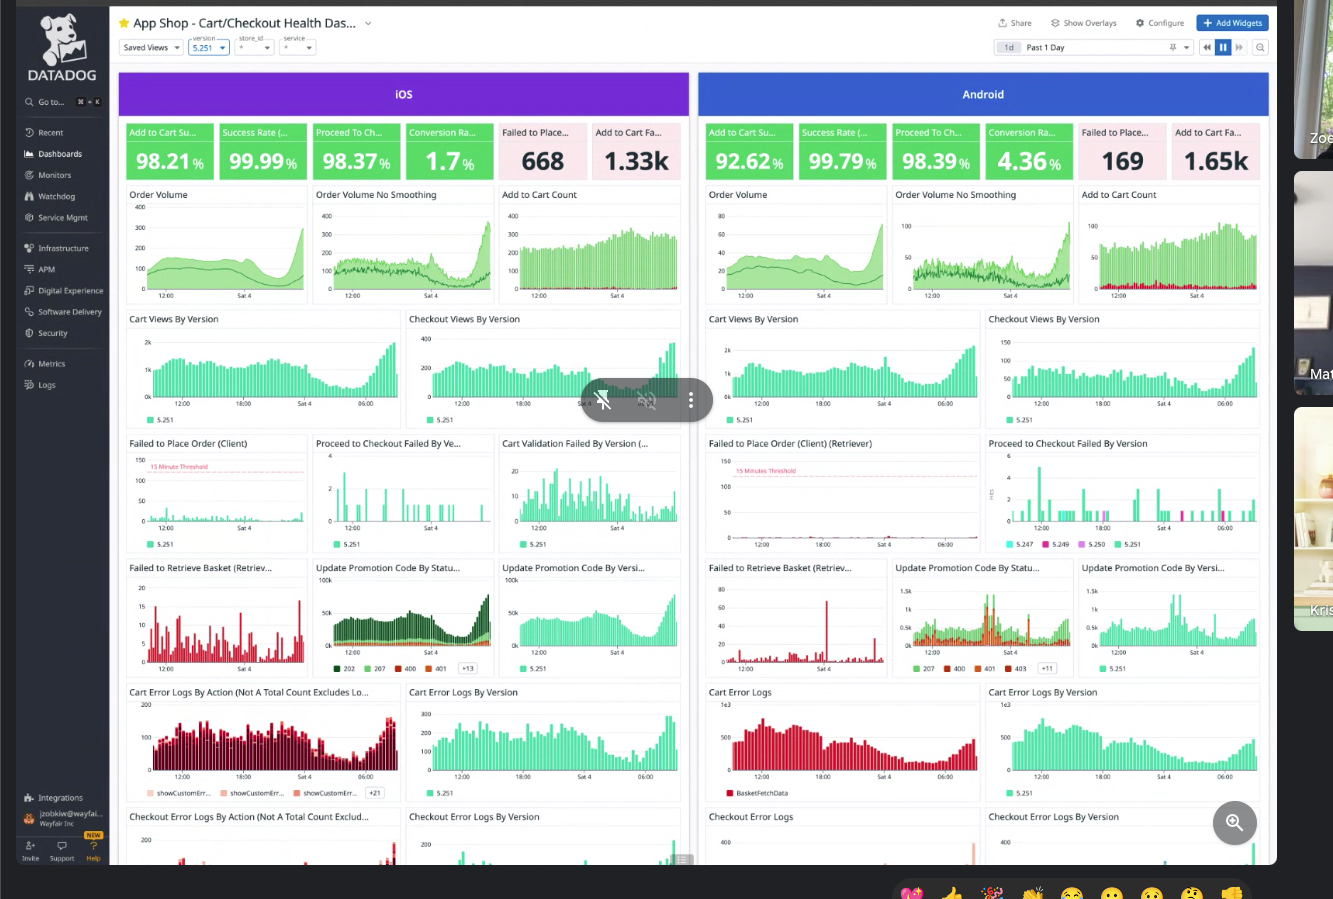
As Senior Technical CX Program Manager, I led the program across Web and App from strategy through delivery. I coordinated 35+ teams and 200+ contributors, implemented the program structure, visualized progress, managed risk, and introduced GenAI-powered reporting.


The Challenge

Release Phases
Custom diagrams like this phased release plan ensured alignment across domains.

The program had major gaps:

  • 22% adoption rate, far below expectations
  • 0% goal achievement in the prior cycle
  • Unclear dependencies and delivery risks
  • 35+ teams working without unified coordination
  • No shared progress visibility for leadership
  • Misaligned stakeholder priorities

Failure would have compromised the platform foundation for customer experience at Wayfair. My goal was to stabilize, realign, and deliver.


Discovery and Frameworks

Image of a whiteboard
Whiteboard from team session to align on a path forward for program-level delivery optimization

Dependency Mapping

JIRA MVP Progress
Mapping dependencies across customer journeys and cross-functional teams.
Diagram of dependencies mapping
Visual showing planned agile work rolling up to OKRs.
  • Mapped 100+ dependencies across all domains
  • Created shared taxonomy and impact scoring
  • Prioritized critical paths and unblock sequencing

Accountability Structure

Accountability Structure diagram
Defined ownership from strategy to delivery to improve speed and autonomy.
  • Implemented a RACI model
  • Defined escalation and resolution paths
  • Created aligned communication and reporting loops

Visibility and Alignment

Progress Visualization

OKRs progress slide
Visualized progress against OKRs and milestones.
Image explaining RAID log
Example risk management RAID log used during the weekly, 35+ person Scrums of Scrums that I led.
  • Dashboarded live adoption, risk, and team progress
  • Built milestone timelines and cycle targets
  • Improved transparency for VPs and Directors

Roadmap Realignment

Roadmap planning
Rebuilt roadmap structure to reflect delivery logic and priorities.
Jira Roadmaps
Example Jira Advanced Roadmap showing scope aligned to KR outcomes. There were ~20 KR outcomes per planning cycle.
  • Broke down delivery into high-impact increments
  • Aligned roadmap with dependency maps and OKRs
  • Phased rollout by journey and platform readiness

AI-Powered Reporting

OKRs Tool
GenAI-powered tool that connected Jira to strategic outcomes.

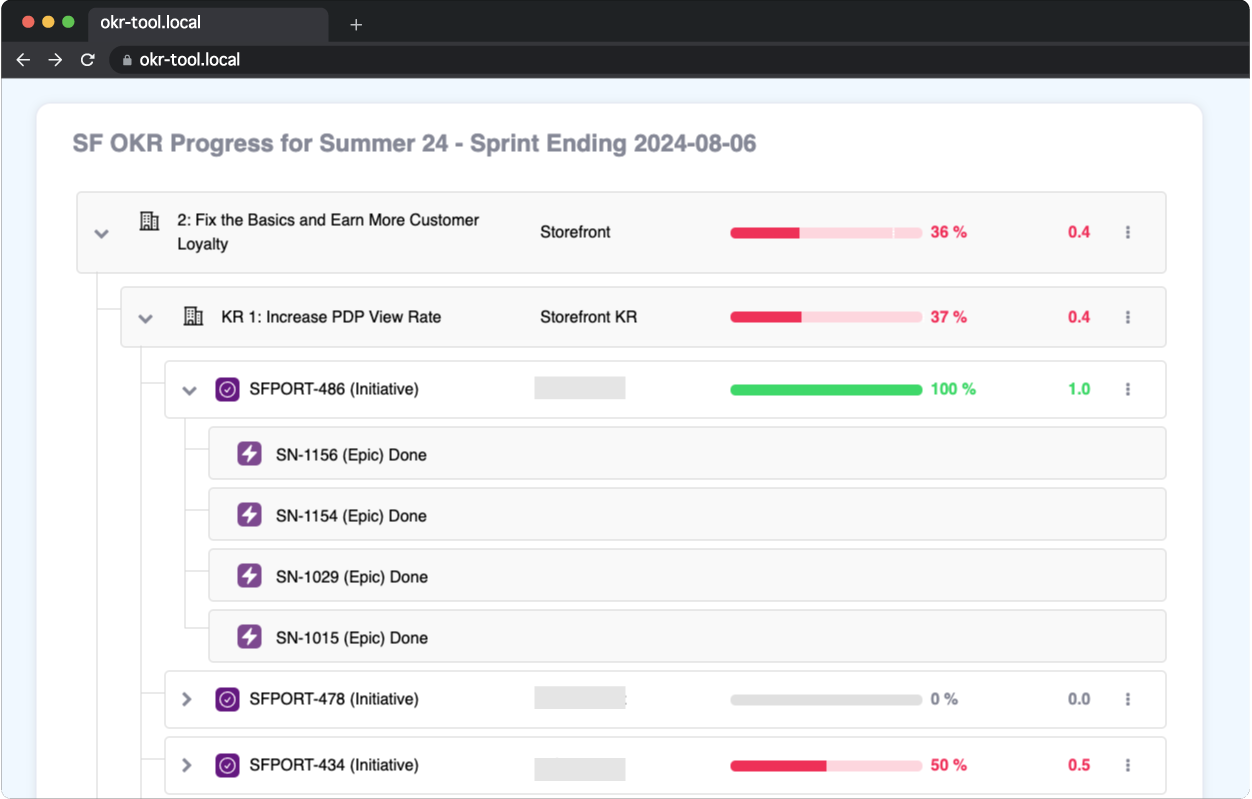
I built Wayfair’s first GenAI program reporting system:

  • Synced OKRs with real-time Jira data
  • Flagged risks before blockers emerged
  • Created weekly insights for leadership review
  • Automated user story generation for clarity

Execution and Launch

Milestone tracker
Milestone tracker used across teams to track cycle delivery.
  • Delivered real adoption increases in three consecutive quarters
  • Focused teams using incremental milestone plans
  • Balanced feature development and platform migration

The Solution

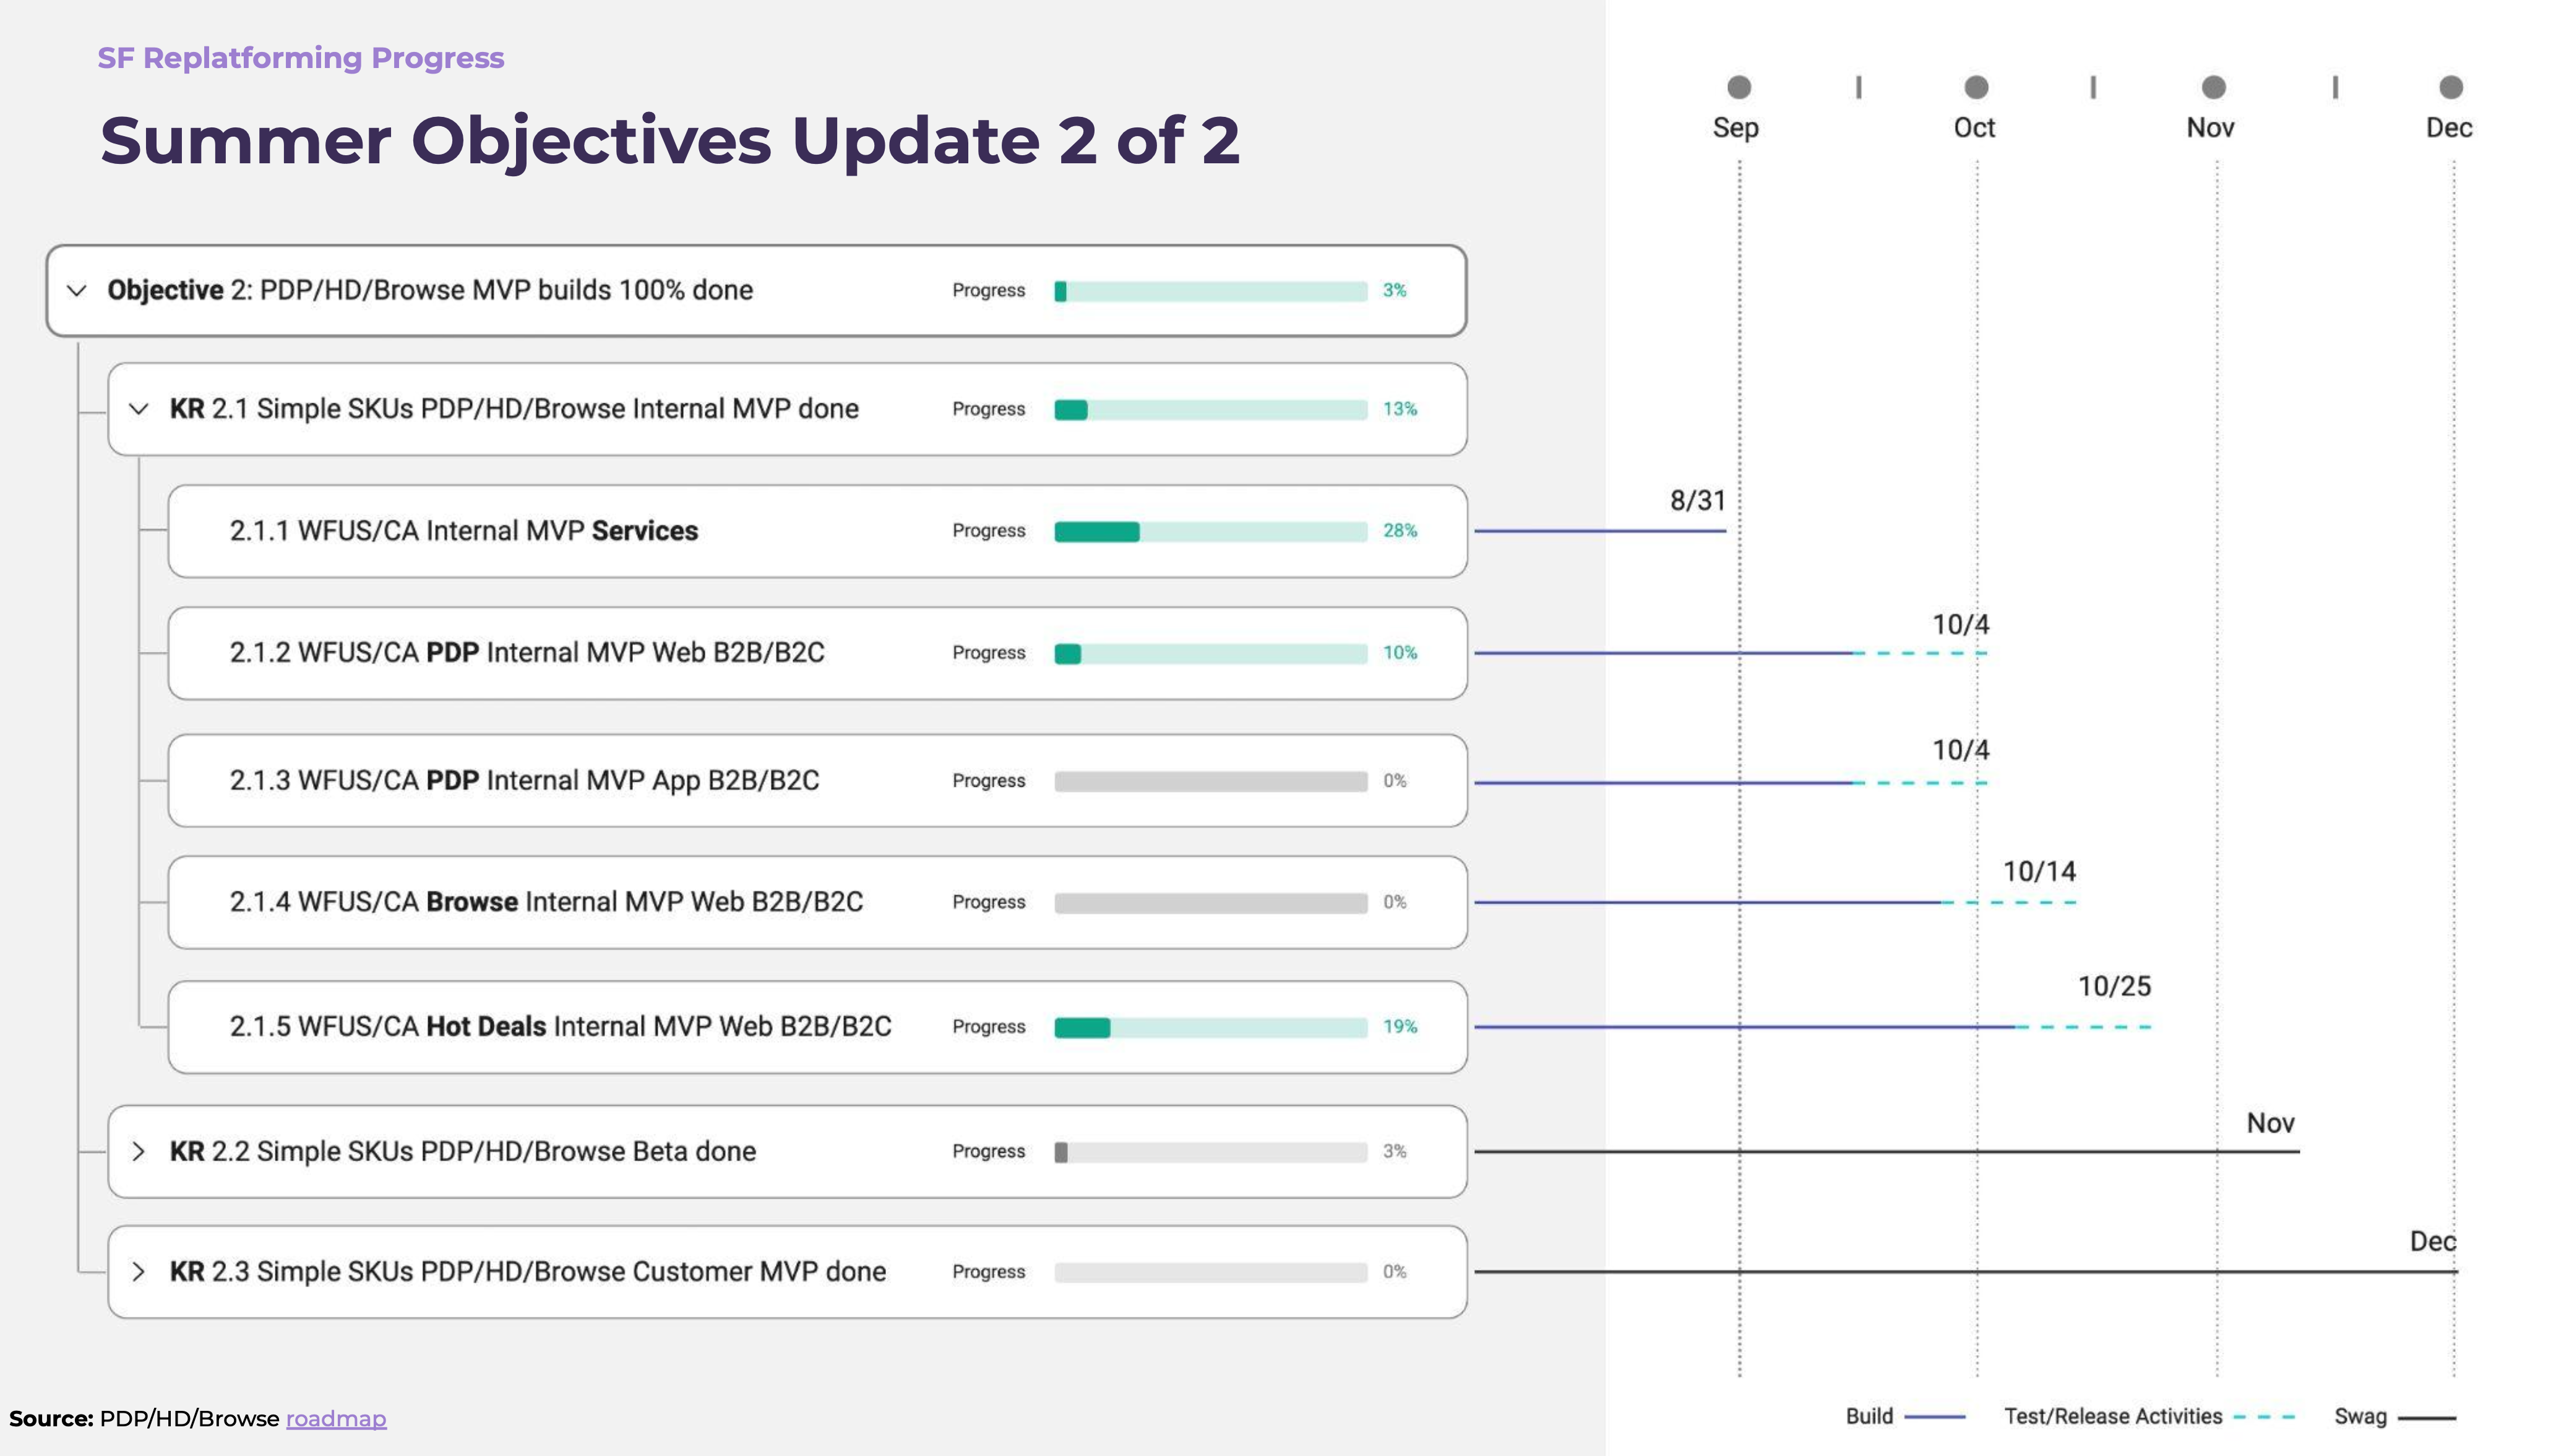
The coordinated strategy I implemented resulted in:

  1. A “one team” delivery approach across 35+ groups
  2. Transparent dependency tracking and issue escalation
  3. Centralized progress visualization for leadership
  4. AI-enhanced reporting and user story generation
  5. Strategic prioritization based on revenue and readiness
Scope doc
Scope templates standardized planning and ensured consistency.
Image of release checklist
Release checklist template I created to ensure all dependencies were accounted for and stakeholders have signed off on the launch.
Team at launch
Cross-functional launch team working on go-live day.
Health metrics dashboard
Monitored platform performance to mitigate launch risk.

Outcomes

Cycle success slide
Cycle completion stats from executive reporting deck.
72% adoption (up from 22%)
100% of goals achieved 3 cycles in a row
Platform drove $68M+ in new revenue
Feature launches were 40% faster
Improved team morale and lower burnout
Stronger cross-functional collaboration

Lessons Learned

  1. Visibility drives velocity
    Transparent progress tracking unlocks productivity

  2. Empathy enables leadership
    Understanding constraints makes change sustainable

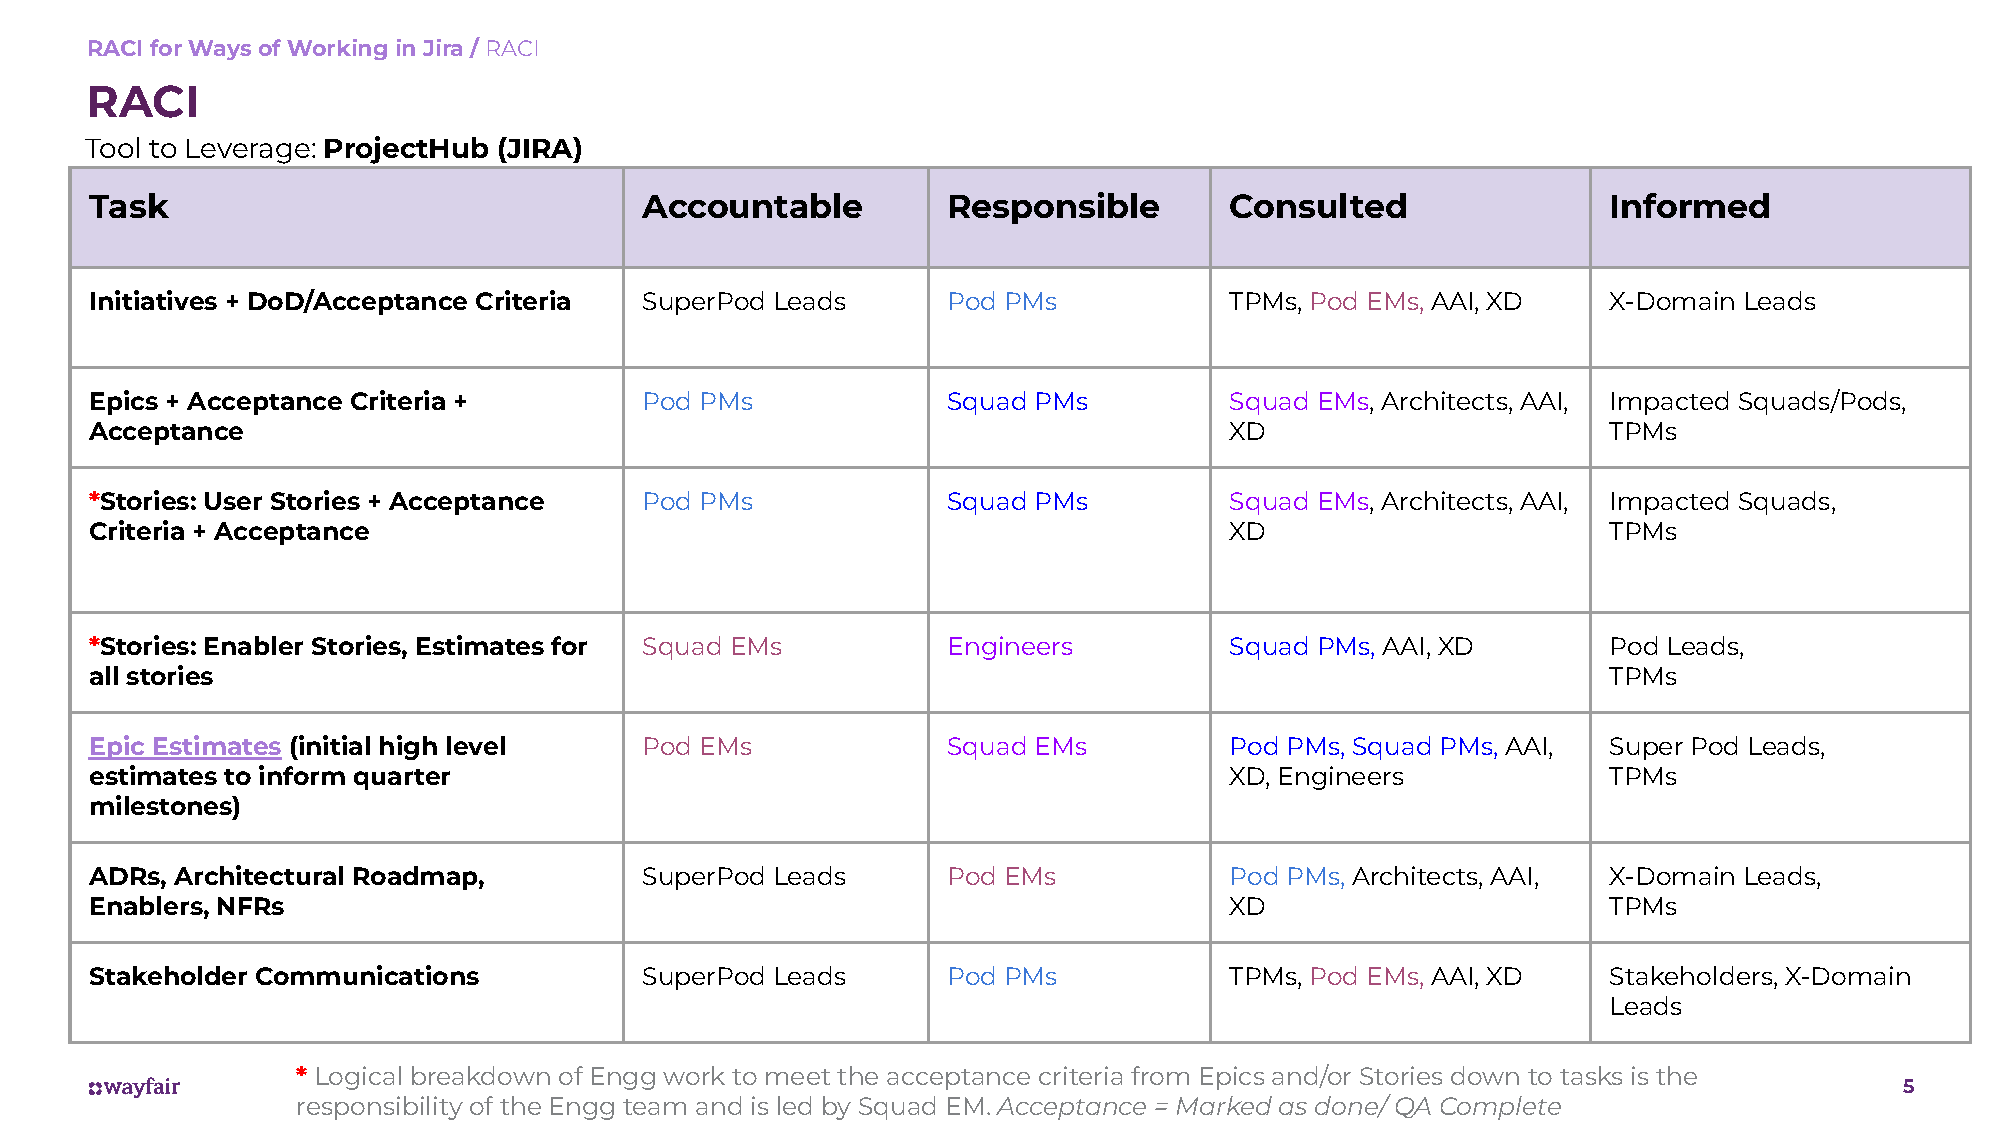
  3. Structure supports creativity
    A shared framework frees teams to do great work

  4. AI unlocks insight at scale
    GenAI reporting changed the speed and quality of decision-making

  5. Integration is harder than implementation
    Culture and coordination take more effort than code

More Case Studies

American Express Market Foundation:

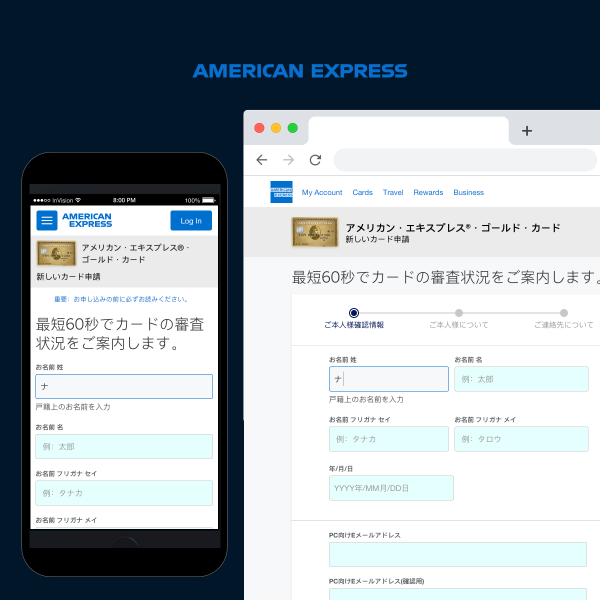
Redesigning Global Card Applications, Driving 1.2M+ Adoptions

American Express SafeKey:

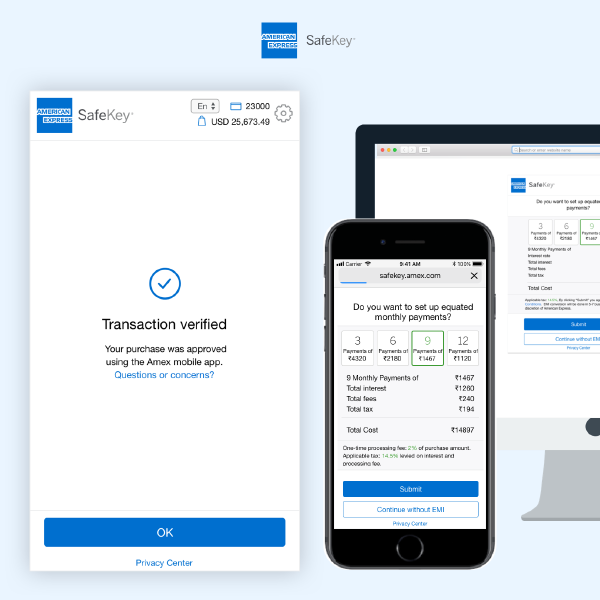
Reducing Checkout Abandonment by 70% While Enhancing Security

V1 Golf Swing Analyzer App:

Redesigning Video Analysis for 4M+ Users Worldwide

V1 Golf Pro Portal:
V1 Golf Pro Portal:

Transforming Client Management for Golf Professionals

Bare Minerals Loyalty Program:

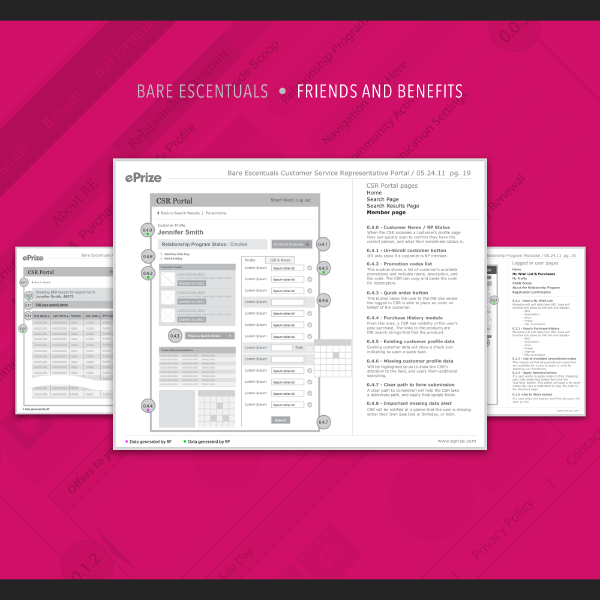
Designing a 13-Year Running Multi-Channel Customer Experience